Immigrants from Uzbekistan vs Immigrants from Philippines Bachelor's Degree
COMPARE
Immigrants from Uzbekistan
Immigrants from Philippines
Bachelor's Degree
Bachelor's Degree Comparison
Immigrants from Uzbekistan
Immigrants from Philippines
42.8%
BACHELOR'S DEGREE
99.5/ 100
METRIC RATING
73rd/ 347
METRIC RANK
36.4%
BACHELOR'S DEGREE
17.8/ 100
METRIC RATING
212th/ 347
METRIC RANK
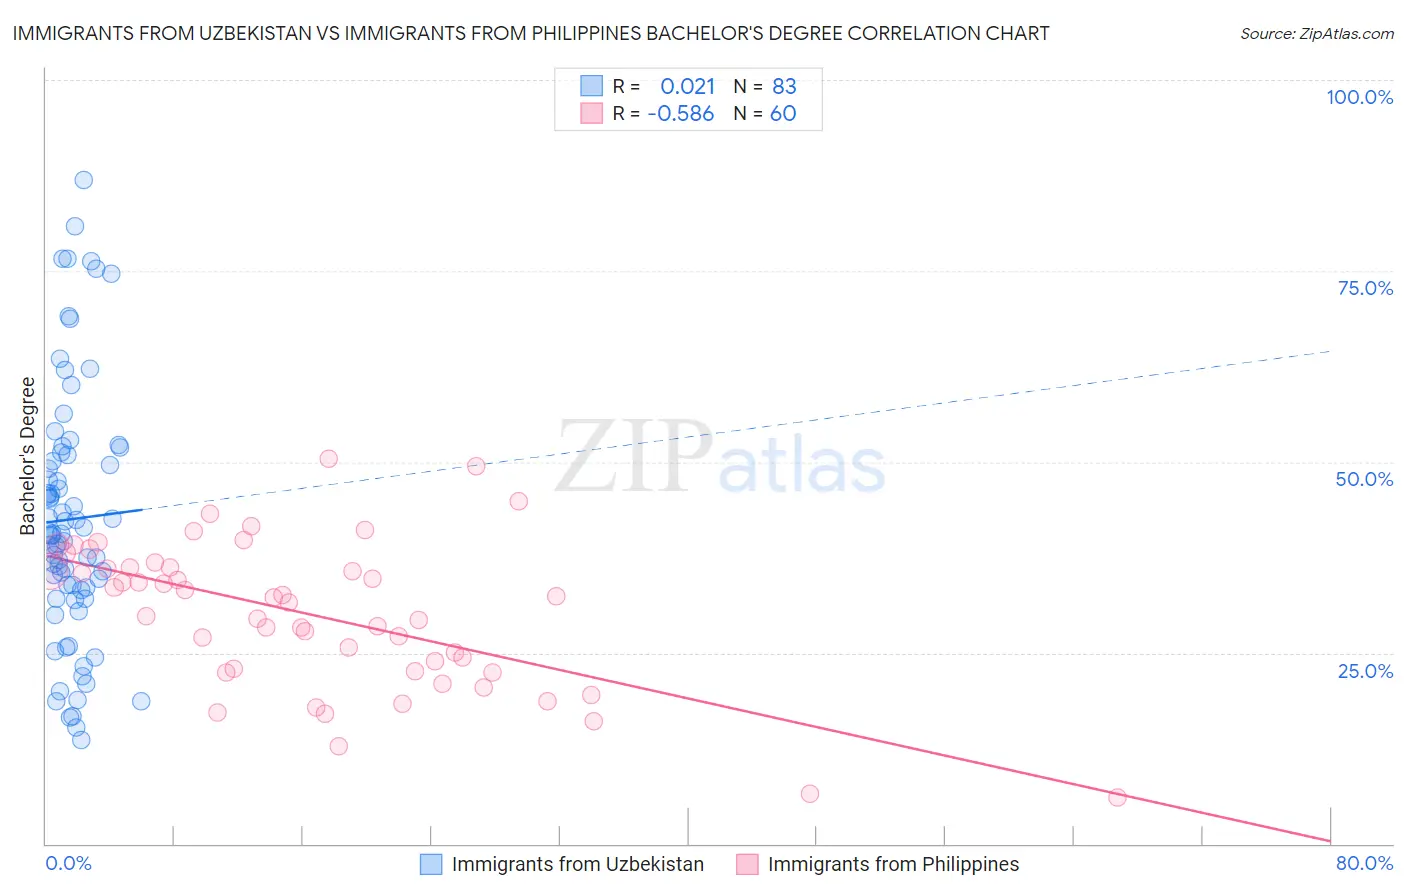
Immigrants from Uzbekistan vs Immigrants from Philippines Bachelor's Degree Correlation Chart
The statistical analysis conducted on geographies consisting of 118,752,495 people shows no correlation between the proportion of Immigrants from Uzbekistan and percentage of population with at least bachelor's degree education in the United States with a correlation coefficient (R) of 0.021 and weighted average of 42.8%. Similarly, the statistical analysis conducted on geographies consisting of 471,284,617 people shows a substantial negative correlation between the proportion of Immigrants from Philippines and percentage of population with at least bachelor's degree education in the United States with a correlation coefficient (R) of -0.586 and weighted average of 36.4%, a difference of 17.4%.
Bachelor's Degree Correlation Summary
| Measurement | Immigrants from Uzbekistan | Immigrants from Philippines |
| Minimum | 13.6% | 6.0% |
| Maximum | 86.9% | 50.4% |
| Range | 73.3% | 44.4% |
| Mean | 42.5% | 30.0% |
| Median | 40.5% | 31.9% |
| Interquartile 25% (IQ1) | 33.2% | 22.8% |
| Interquartile 75% (IQ3) | 50.9% | 36.2% |
| Interquartile Range (IQR) | 17.6% | 13.4% |
| Standard Deviation (Sample) | 16.4% | 9.6% |
| Standard Deviation (Population) | 16.3% | 9.5% |
Similar Demographics by Bachelor's Degree
Demographics Similar to Immigrants from Uzbekistan by Bachelor's Degree
In terms of bachelor's degree, the demographic groups most similar to Immigrants from Uzbekistan are Ethiopian (42.8%, a difference of 0.050%), Immigrants from Argentina (42.8%, a difference of 0.14%), Bhutanese (42.7%, a difference of 0.22%), Immigrants from Romania (42.9%, a difference of 0.40%), and Immigrants from Zimbabwe (42.6%, a difference of 0.44%).
| Demographics | Rating | Rank | Bachelor's Degree |
| Immigrants | Netherlands | 99.7 /100 | #66 | Exceptional 43.3% |
| Egyptians | 99.7 /100 | #67 | Exceptional 43.3% |
| Immigrants | Indonesia | 99.7 /100 | #68 | Exceptional 43.3% |
| Immigrants | Pakistan | 99.7 /100 | #69 | Exceptional 43.1% |
| Immigrants | Romania | 99.6 /100 | #70 | Exceptional 42.9% |
| Immigrants | Argentina | 99.6 /100 | #71 | Exceptional 42.8% |
| Ethiopians | 99.5 /100 | #72 | Exceptional 42.8% |
| Immigrants | Uzbekistan | 99.5 /100 | #73 | Exceptional 42.8% |
| Bhutanese | 99.5 /100 | #74 | Exceptional 42.7% |
| Immigrants | Zimbabwe | 99.4 /100 | #75 | Exceptional 42.6% |
| Immigrants | Egypt | 99.4 /100 | #76 | Exceptional 42.6% |
| Immigrants | Eastern Europe | 99.4 /100 | #77 | Exceptional 42.5% |
| Immigrants | Ethiopia | 99.4 /100 | #78 | Exceptional 42.5% |
| Immigrants | Lebanon | 99.3 /100 | #79 | Exceptional 42.4% |
| Immigrants | Croatia | 99.2 /100 | #80 | Exceptional 42.3% |
Demographics Similar to Immigrants from Philippines by Bachelor's Degree
In terms of bachelor's degree, the demographic groups most similar to Immigrants from Philippines are Scotch-Irish (36.4%, a difference of 0.080%), French (36.5%, a difference of 0.13%), Panamanian (36.5%, a difference of 0.16%), Immigrants from Thailand (36.5%, a difference of 0.26%), and Immigrants from Middle Africa (36.6%, a difference of 0.45%).
| Demographics | Rating | Rank | Bachelor's Degree |
| Finns | 22.2 /100 | #205 | Fair 36.7% |
| Spaniards | 21.2 /100 | #206 | Fair 36.6% |
| Immigrants | Middle Africa | 20.6 /100 | #207 | Fair 36.6% |
| Immigrants | Thailand | 19.4 /100 | #208 | Poor 36.5% |
| Panamanians | 18.8 /100 | #209 | Poor 36.5% |
| French | 18.6 /100 | #210 | Poor 36.5% |
| Scotch-Irish | 18.3 /100 | #211 | Poor 36.4% |
| Immigrants | Philippines | 17.8 /100 | #212 | Poor 36.4% |
| Immigrants | Panama | 14.2 /100 | #213 | Poor 36.2% |
| Germans | 13.9 /100 | #214 | Poor 36.1% |
| Immigrants | Western Africa | 13.8 /100 | #215 | Poor 36.1% |
| Barbadians | 13.5 /100 | #216 | Poor 36.1% |
| German Russians | 10.2 /100 | #217 | Poor 35.8% |
| Sub-Saharan Africans | 9.8 /100 | #218 | Tragic 35.8% |
| West Indians | 9.7 /100 | #219 | Tragic 35.8% |