Immigrants from Middle Africa vs Immigrants from Africa Doctorate Degree
COMPARE
Immigrants from Middle Africa
Immigrants from Africa
Doctorate Degree
Doctorate Degree Comparison
Immigrants from Middle Africa
Immigrants from Africa
1.9%
DOCTORATE DEGREE
68.8/ 100
METRIC RATING
161st/ 347
METRIC RANK
2.0%
DOCTORATE DEGREE
87.0/ 100
METRIC RATING
140th/ 347
METRIC RANK
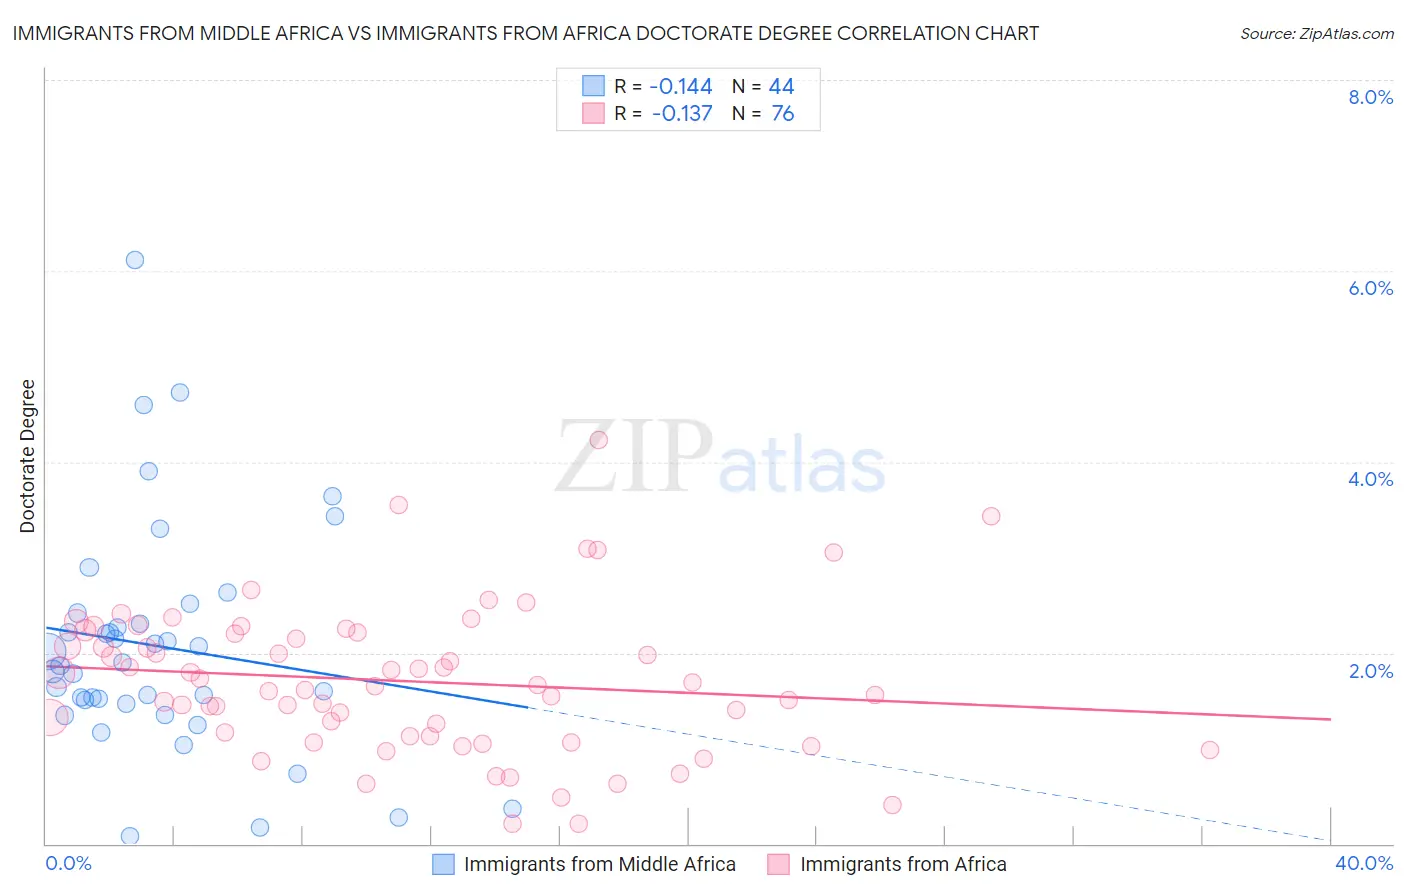
Immigrants from Middle Africa vs Immigrants from Africa Doctorate Degree Correlation Chart
The statistical analysis conducted on geographies consisting of 202,038,624 people shows a poor negative correlation between the proportion of Immigrants from Middle Africa and percentage of population with at least doctorate degree education in the United States with a correlation coefficient (R) of -0.144 and weighted average of 1.9%. Similarly, the statistical analysis conducted on geographies consisting of 463,247,736 people shows a poor negative correlation between the proportion of Immigrants from Africa and percentage of population with at least doctorate degree education in the United States with a correlation coefficient (R) of -0.137 and weighted average of 2.0%, a difference of 3.9%.
Doctorate Degree Correlation Summary
| Measurement | Immigrants from Middle Africa | Immigrants from Africa |
| Minimum | 0.076% | 0.20% |
| Maximum | 6.1% | 4.2% |
| Range | 6.0% | 4.0% |
| Mean | 2.1% | 1.7% |
| Median | 1.9% | 1.7% |
| Interquartile 25% (IQ1) | 1.5% | 1.1% |
| Interquartile 75% (IQ3) | 2.4% | 2.2% |
| Interquartile Range (IQR) | 0.87% | 1.1% |
| Standard Deviation (Sample) | 1.2% | 0.78% |
| Standard Deviation (Population) | 1.2% | 0.77% |
Similar Demographics by Doctorate Degree
Demographics Similar to Immigrants from Middle Africa by Doctorate Degree
In terms of doctorate degree, the demographic groups most similar to Immigrants from Middle Africa are Welsh (1.9%, a difference of 0.15%), Irish (1.9%, a difference of 0.21%), Slovene (1.9%, a difference of 0.24%), Czech (1.9%, a difference of 0.25%), and Celtic (1.9%, a difference of 0.35%).
| Demographics | Rating | Rank | Doctorate Degree |
| Immigrants | Albania | 72.8 /100 | #154 | Good 1.9% |
| Poles | 72.7 /100 | #155 | Good 1.9% |
| Slavs | 72.4 /100 | #156 | Good 1.9% |
| Danes | 71.9 /100 | #157 | Good 1.9% |
| Hungarians | 71.7 /100 | #158 | Good 1.9% |
| Slovenes | 70.2 /100 | #159 | Good 1.9% |
| Welsh | 69.7 /100 | #160 | Good 1.9% |
| Immigrants | Middle Africa | 68.8 /100 | #161 | Good 1.9% |
| Irish | 67.5 /100 | #162 | Good 1.9% |
| Czechs | 67.3 /100 | #163 | Good 1.9% |
| Celtics | 66.7 /100 | #164 | Good 1.9% |
| Scotch-Irish | 63.6 /100 | #165 | Good 1.9% |
| Spaniards | 63.5 /100 | #166 | Good 1.9% |
| Macedonians | 60.9 /100 | #167 | Good 1.9% |
| Sri Lankans | 60.3 /100 | #168 | Good 1.9% |
Demographics Similar to Immigrants from Africa by Doctorate Degree
In terms of doctorate degree, the demographic groups most similar to Immigrants from Africa are Senegalese (2.0%, a difference of 0.070%), Afghan (2.0%, a difference of 0.080%), Italian (2.0%, a difference of 0.28%), Swiss (2.0%, a difference of 0.31%), and South American Indian (2.0%, a difference of 0.40%).
| Demographics | Rating | Rank | Doctorate Degree |
| Immigrants | Uzbekistan | 89.3 /100 | #133 | Excellent 2.0% |
| Immigrants | Cameroon | 88.9 /100 | #134 | Excellent 2.0% |
| Serbians | 88.7 /100 | #135 | Excellent 2.0% |
| Swedes | 88.3 /100 | #136 | Excellent 2.0% |
| South American Indians | 88.3 /100 | #137 | Excellent 2.0% |
| Swiss | 88.0 /100 | #138 | Excellent 2.0% |
| Afghans | 87.2 /100 | #139 | Excellent 2.0% |
| Immigrants | Africa | 87.0 /100 | #140 | Excellent 2.0% |
| Senegalese | 86.7 /100 | #141 | Excellent 2.0% |
| Italians | 86.0 /100 | #142 | Excellent 2.0% |
| Sierra Leoneans | 85.1 /100 | #143 | Excellent 2.0% |
| Immigrants | Moldova | 84.3 /100 | #144 | Excellent 2.0% |
| Kenyans | 83.6 /100 | #145 | Excellent 1.9% |
| Immigrants | Syria | 83.6 /100 | #146 | Excellent 1.9% |
| Immigrants | Senegal | 82.5 /100 | #147 | Excellent 1.9% |