Lebanese vs Dutch 2nd Grade
COMPARE
Lebanese
Dutch
2nd Grade
2nd Grade Comparison
Lebanese
Dutch
98.1%
2ND GRADE
94.2/ 100
METRIC RATING
122nd/ 347
METRIC RANK
98.6%
2ND GRADE
100.0/ 100
METRIC RATING
16th/ 347
METRIC RANK
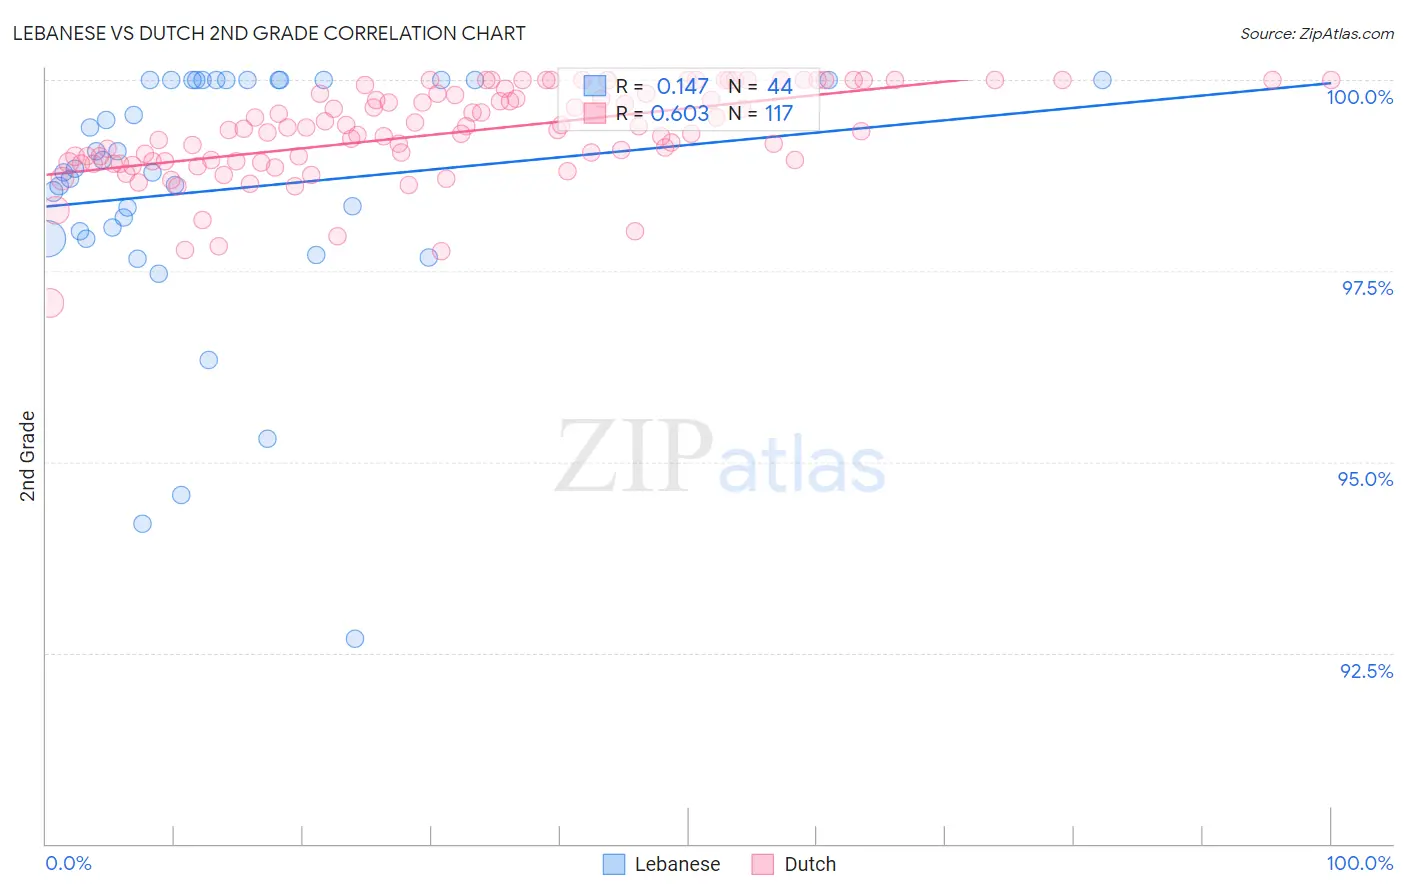
Lebanese vs Dutch 2nd Grade Correlation Chart
The statistical analysis conducted on geographies consisting of 401,624,157 people shows a poor positive correlation between the proportion of Lebanese and percentage of population with at least 2nd grade education in the United States with a correlation coefficient (R) of 0.147 and weighted average of 98.1%. Similarly, the statistical analysis conducted on geographies consisting of 554,359,260 people shows a significant positive correlation between the proportion of Dutch and percentage of population with at least 2nd grade education in the United States with a correlation coefficient (R) of 0.603 and weighted average of 98.6%, a difference of 0.51%.
2nd Grade Correlation Summary
| Measurement | Lebanese | Dutch |
| Minimum | 92.7% | 97.1% |
| Maximum | 100.0% | 100.0% |
| Range | 7.3% | 2.9% |
| Mean | 98.6% | 99.3% |
| Median | 98.8% | 99.4% |
| Interquartile 25% (IQ1) | 98.0% | 98.9% |
| Interquartile 75% (IQ3) | 100.0% | 99.8% |
| Interquartile Range (IQR) | 2.0% | 0.89% |
| Standard Deviation (Sample) | 1.7% | 0.60% |
| Standard Deviation (Population) | 1.7% | 0.60% |
Similar Demographics by 2nd Grade
Demographics Similar to Lebanese by 2nd Grade
In terms of 2nd grade, the demographic groups most similar to Lebanese are Immigrants from Zimbabwe (98.1%, a difference of 0.0%), Immigrants from Japan (98.1%, a difference of 0.0%), Menominee (98.1%, a difference of 0.0%), Iroquois (98.1%, a difference of 0.0%), and Syrian (98.1%, a difference of 0.0%).
| Demographics | Rating | Rank | 2nd Grade |
| Iranians | 95.9 /100 | #115 | Exceptional 98.1% |
| Spanish | 95.8 /100 | #116 | Exceptional 98.1% |
| Ute | 95.7 /100 | #117 | Exceptional 98.1% |
| Immigrants | France | 95.6 /100 | #118 | Exceptional 98.1% |
| Thais | 95.3 /100 | #119 | Exceptional 98.1% |
| Okinawans | 94.9 /100 | #120 | Exceptional 98.1% |
| Immigrants | Zimbabwe | 94.4 /100 | #121 | Exceptional 98.1% |
| Lebanese | 94.2 /100 | #122 | Exceptional 98.1% |
| Immigrants | Japan | 94.1 /100 | #123 | Exceptional 98.1% |
| Menominee | 94.1 /100 | #124 | Exceptional 98.1% |
| Iroquois | 94.1 /100 | #125 | Exceptional 98.1% |
| Syrians | 94.0 /100 | #126 | Exceptional 98.1% |
| Immigrants | Saudi Arabia | 93.6 /100 | #127 | Exceptional 98.1% |
| Immigrants | Serbia | 92.3 /100 | #128 | Exceptional 98.1% |
| Immigrants | Croatia | 92.1 /100 | #129 | Exceptional 98.1% |
Demographics Similar to Dutch by 2nd Grade
In terms of 2nd grade, the demographic groups most similar to Dutch are Scottish (98.6%, a difference of 0.010%), Swedish (98.6%, a difference of 0.020%), Aleut (98.6%, a difference of 0.020%), Irish (98.6%, a difference of 0.020%), and Finnish (98.5%, a difference of 0.030%).
| Demographics | Rating | Rank | 2nd Grade |
| Slovaks | 100.0 /100 | #9 | Exceptional 98.7% |
| Slovenes | 100.0 /100 | #10 | Exceptional 98.6% |
| Tlingit-Haida | 100.0 /100 | #11 | Exceptional 98.6% |
| Carpatho Rusyns | 100.0 /100 | #12 | Exceptional 98.6% |
| English | 100.0 /100 | #13 | Exceptional 98.6% |
| Swedes | 100.0 /100 | #14 | Exceptional 98.6% |
| Scottish | 100.0 /100 | #15 | Exceptional 98.6% |
| Dutch | 100.0 /100 | #16 | Exceptional 98.6% |
| Aleuts | 100.0 /100 | #17 | Exceptional 98.6% |
| Irish | 100.0 /100 | #18 | Exceptional 98.6% |
| Finns | 100.0 /100 | #19 | Exceptional 98.5% |
| Sioux | 100.0 /100 | #20 | Exceptional 98.5% |
| Lithuanians | 100.0 /100 | #21 | Exceptional 98.5% |
| Poles | 100.0 /100 | #22 | Exceptional 98.5% |
| Danes | 100.0 /100 | #23 | Exceptional 98.5% |