Immigrants from Armenia vs Latvian 10th Grade
COMPARE
Immigrants from Armenia
Latvian
10th Grade
10th Grade Comparison
Immigrants from Armenia
Latvians
89.9%
10TH GRADE
0.0/ 100
METRIC RATING
324th/ 347
METRIC RANK
95.6%
10TH GRADE
100.0/ 100
METRIC RATING
17th/ 347
METRIC RANK
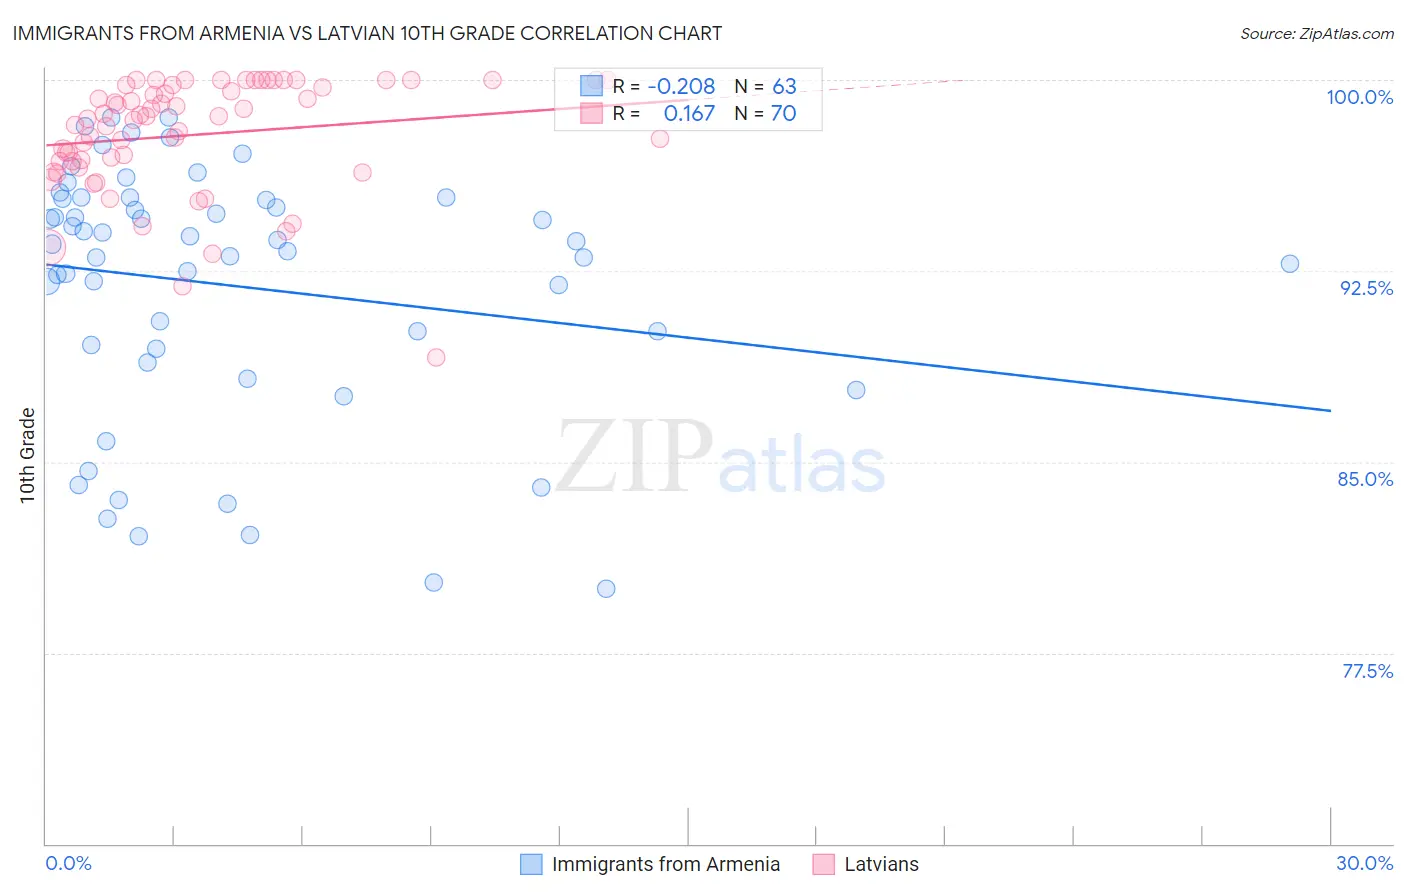
Immigrants from Armenia vs Latvian 10th Grade Correlation Chart
The statistical analysis conducted on geographies consisting of 97,657,339 people shows a weak negative correlation between the proportion of Immigrants from Armenia and percentage of population with at least 10th grade education in the United States with a correlation coefficient (R) of -0.208 and weighted average of 89.9%. Similarly, the statistical analysis conducted on geographies consisting of 220,726,693 people shows a poor positive correlation between the proportion of Latvians and percentage of population with at least 10th grade education in the United States with a correlation coefficient (R) of 0.167 and weighted average of 95.6%, a difference of 6.4%.
10th Grade Correlation Summary
| Measurement | Immigrants from Armenia | Latvian |
| Minimum | 80.0% | 89.1% |
| Maximum | 98.5% | 100.0% |
| Range | 18.5% | 10.9% |
| Mean | 91.9% | 97.8% |
| Median | 93.5% | 98.5% |
| Interquartile 25% (IQ1) | 89.4% | 96.8% |
| Interquartile 75% (IQ3) | 95.4% | 99.8% |
| Interquartile Range (IQR) | 5.9% | 3.0% |
| Standard Deviation (Sample) | 4.9% | 2.2% |
| Standard Deviation (Population) | 4.9% | 2.2% |
Similar Demographics by 10th Grade
Demographics Similar to Immigrants from Armenia by 10th Grade
In terms of 10th grade, the demographic groups most similar to Immigrants from Armenia are Puerto Rican (89.8%, a difference of 0.020%), Central American Indian (89.7%, a difference of 0.20%), Immigrants from Belize (90.1%, a difference of 0.22%), Tohono O'odham (90.1%, a difference of 0.31%), and Houma (90.2%, a difference of 0.32%).
| Demographics | Rating | Rank | 10th Grade |
| Immigrants | Ecuador | 0.0 /100 | #317 | Tragic 90.4% |
| Immigrants | Cuba | 0.0 /100 | #318 | Tragic 90.2% |
| Nicaraguans | 0.0 /100 | #319 | Tragic 90.2% |
| Houma | 0.0 /100 | #320 | Tragic 90.2% |
| Belizeans | 0.0 /100 | #321 | Tragic 90.2% |
| Tohono O'odham | 0.0 /100 | #322 | Tragic 90.1% |
| Immigrants | Belize | 0.0 /100 | #323 | Tragic 90.1% |
| Immigrants | Armenia | 0.0 /100 | #324 | Tragic 89.9% |
| Puerto Ricans | 0.0 /100 | #325 | Tragic 89.8% |
| Central American Indians | 0.0 /100 | #326 | Tragic 89.7% |
| Immigrants | Nicaragua | 0.0 /100 | #327 | Tragic 89.5% |
| Immigrants | Cabo Verde | 0.0 /100 | #328 | Tragic 89.5% |
| Dominicans | 0.0 /100 | #329 | Tragic 89.4% |
| Immigrants | Yemen | 0.0 /100 | #330 | Tragic 89.1% |
| Mexican American Indians | 0.0 /100 | #331 | Tragic 89.0% |
Demographics Similar to Latvians by 10th Grade
In terms of 10th grade, the demographic groups most similar to Latvians are Scottish (95.6%, a difference of 0.010%), Italian (95.6%, a difference of 0.010%), Scandinavian (95.6%, a difference of 0.010%), Irish (95.6%, a difference of 0.020%), and Chinese (95.5%, a difference of 0.030%).
| Demographics | Rating | Rank | 10th Grade |
| Croatians | 100.0 /100 | #10 | Exceptional 95.7% |
| Danes | 100.0 /100 | #11 | Exceptional 95.7% |
| Tlingit-Haida | 100.0 /100 | #12 | Exceptional 95.7% |
| English | 100.0 /100 | #13 | Exceptional 95.6% |
| Tsimshian | 100.0 /100 | #14 | Exceptional 95.6% |
| Irish | 100.0 /100 | #15 | Exceptional 95.6% |
| Scottish | 100.0 /100 | #16 | Exceptional 95.6% |
| Latvians | 100.0 /100 | #17 | Exceptional 95.6% |
| Italians | 100.0 /100 | #18 | Exceptional 95.6% |
| Scandinavians | 100.0 /100 | #19 | Exceptional 95.6% |
| Chinese | 100.0 /100 | #20 | Exceptional 95.5% |
| Dutch | 100.0 /100 | #21 | Exceptional 95.5% |
| Eastern Europeans | 100.0 /100 | #22 | Exceptional 95.5% |
| Czechs | 100.0 /100 | #23 | Exceptional 95.5% |
| Europeans | 100.0 /100 | #24 | Exceptional 95.5% |