Pueblo vs Tsimshian Master's Degree
COMPARE
Pueblo
Tsimshian
Master's Degree
Master's Degree Comparison
Pueblo
Tsimshian
10.3%
MASTER'S DEGREE
0.0/ 100
METRIC RATING
331st/ 347
METRIC RANK
11.4%
MASTER'S DEGREE
0.1/ 100
METRIC RATING
301st/ 347
METRIC RANK
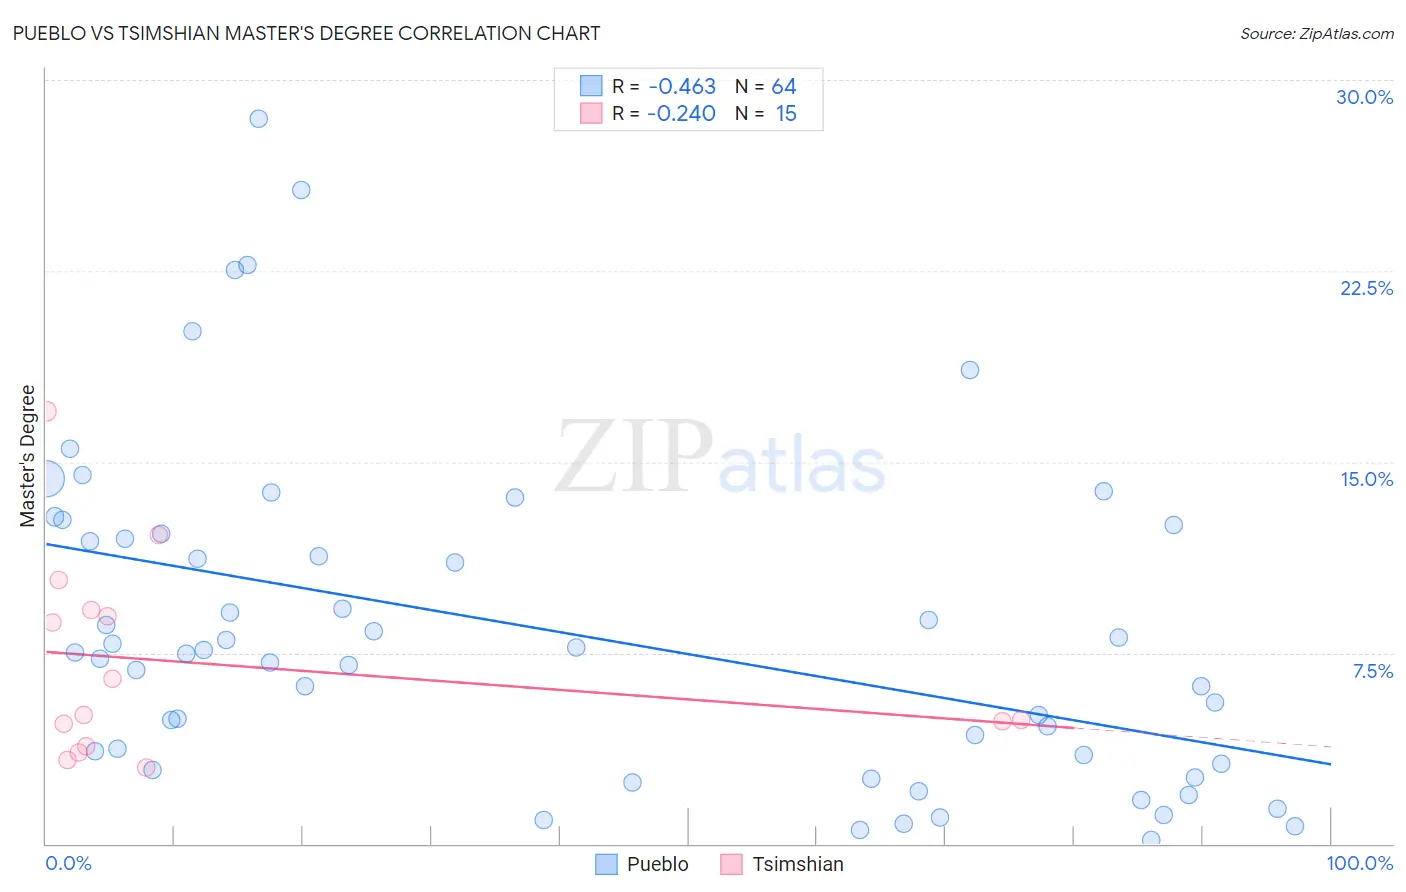
Pueblo vs Tsimshian Master's Degree Correlation Chart
The statistical analysis conducted on geographies consisting of 120,067,726 people shows a moderate negative correlation between the proportion of Pueblo and percentage of population with at least master's degree education in the United States with a correlation coefficient (R) of -0.463 and weighted average of 10.3%. Similarly, the statistical analysis conducted on geographies consisting of 15,626,544 people shows a weak negative correlation between the proportion of Tsimshian and percentage of population with at least master's degree education in the United States with a correlation coefficient (R) of -0.240 and weighted average of 11.4%, a difference of 11.0%.
Master's Degree Correlation Summary
| Measurement | Pueblo | Tsimshian |
| Minimum | 0.12% | 3.0% |
| Maximum | 28.5% | 17.0% |
| Range | 28.3% | 14.0% |
| Mean | 8.4% | 7.1% |
| Median | 7.5% | 5.0% |
| Interquartile 25% (IQ1) | 3.3% | 3.8% |
| Interquartile 75% (IQ3) | 12.1% | 9.2% |
| Interquartile Range (IQR) | 8.8% | 5.3% |
| Standard Deviation (Sample) | 6.4% | 4.0% |
| Standard Deviation (Population) | 6.4% | 3.8% |
Similar Demographics by Master's Degree
Demographics Similar to Pueblo by Master's Degree
In terms of master's degree, the demographic groups most similar to Pueblo are Fijian (10.3%, a difference of 0.16%), Immigrants from the Azores (10.2%, a difference of 0.46%), Menominee (10.2%, a difference of 0.83%), Nepalese (10.5%, a difference of 1.9%), and Bangladeshi (10.5%, a difference of 2.0%).
| Demographics | Rating | Rank | Master's Degree |
| Dutch West Indians | 0.0 /100 | #324 | Tragic 10.6% |
| Inupiat | 0.0 /100 | #325 | Tragic 10.5% |
| Creek | 0.0 /100 | #326 | Tragic 10.5% |
| Paiute | 0.0 /100 | #327 | Tragic 10.5% |
| Bangladeshis | 0.0 /100 | #328 | Tragic 10.5% |
| Nepalese | 0.0 /100 | #329 | Tragic 10.5% |
| Fijians | 0.0 /100 | #330 | Tragic 10.3% |
| Pueblo | 0.0 /100 | #331 | Tragic 10.3% |
| Immigrants | Azores | 0.0 /100 | #332 | Tragic 10.2% |
| Menominee | 0.0 /100 | #333 | Tragic 10.2% |
| Arapaho | 0.0 /100 | #334 | Tragic 10.0% |
| Immigrants | Central America | 0.0 /100 | #335 | Tragic 10.0% |
| Natives/Alaskans | 0.0 /100 | #336 | Tragic 9.9% |
| Mexicans | 0.0 /100 | #337 | Tragic 9.7% |
| Tohono O'odham | 0.0 /100 | #338 | Tragic 9.7% |
Demographics Similar to Tsimshian by Master's Degree
In terms of master's degree, the demographic groups most similar to Tsimshian are Chippewa (11.4%, a difference of 0.16%), Chickasaw (11.4%, a difference of 0.18%), Cherokee (11.4%, a difference of 0.31%), Immigrants from Laos (11.4%, a difference of 0.33%), and Immigrants from Cabo Verde (11.3%, a difference of 0.52%).
| Demographics | Rating | Rank | Master's Degree |
| Hawaiians | 0.1 /100 | #294 | Tragic 11.6% |
| Marshallese | 0.1 /100 | #295 | Tragic 11.6% |
| Alaskan Athabascans | 0.1 /100 | #296 | Tragic 11.6% |
| Immigrants | Yemen | 0.1 /100 | #297 | Tragic 11.6% |
| Samoans | 0.1 /100 | #298 | Tragic 11.5% |
| Chickasaw | 0.1 /100 | #299 | Tragic 11.4% |
| Chippewa | 0.1 /100 | #300 | Tragic 11.4% |
| Tsimshian | 0.1 /100 | #301 | Tragic 11.4% |
| Cherokee | 0.1 /100 | #302 | Tragic 11.4% |
| Immigrants | Laos | 0.1 /100 | #303 | Tragic 11.4% |
| Immigrants | Cabo Verde | 0.1 /100 | #304 | Tragic 11.3% |
| Immigrants | Latin America | 0.0 /100 | #305 | Tragic 11.3% |
| Mexican American Indians | 0.0 /100 | #306 | Tragic 11.2% |
| Cheyenne | 0.0 /100 | #307 | Tragic 11.2% |
| Puerto Ricans | 0.0 /100 | #308 | Tragic 11.2% |