British West Indian vs Immigrants from Belize No Schooling Completed
COMPARE
British West Indian
Immigrants from Belize
No Schooling Completed
No Schooling Completed Comparison
British West Indians
Immigrants from Belize
2.7%
NO SCHOOLING COMPLETED
0.0/ 100
METRIC RATING
291st/ 347
METRIC RANK
3.1%
NO SCHOOLING COMPLETED
0.0/ 100
METRIC RATING
314th/ 347
METRIC RANK
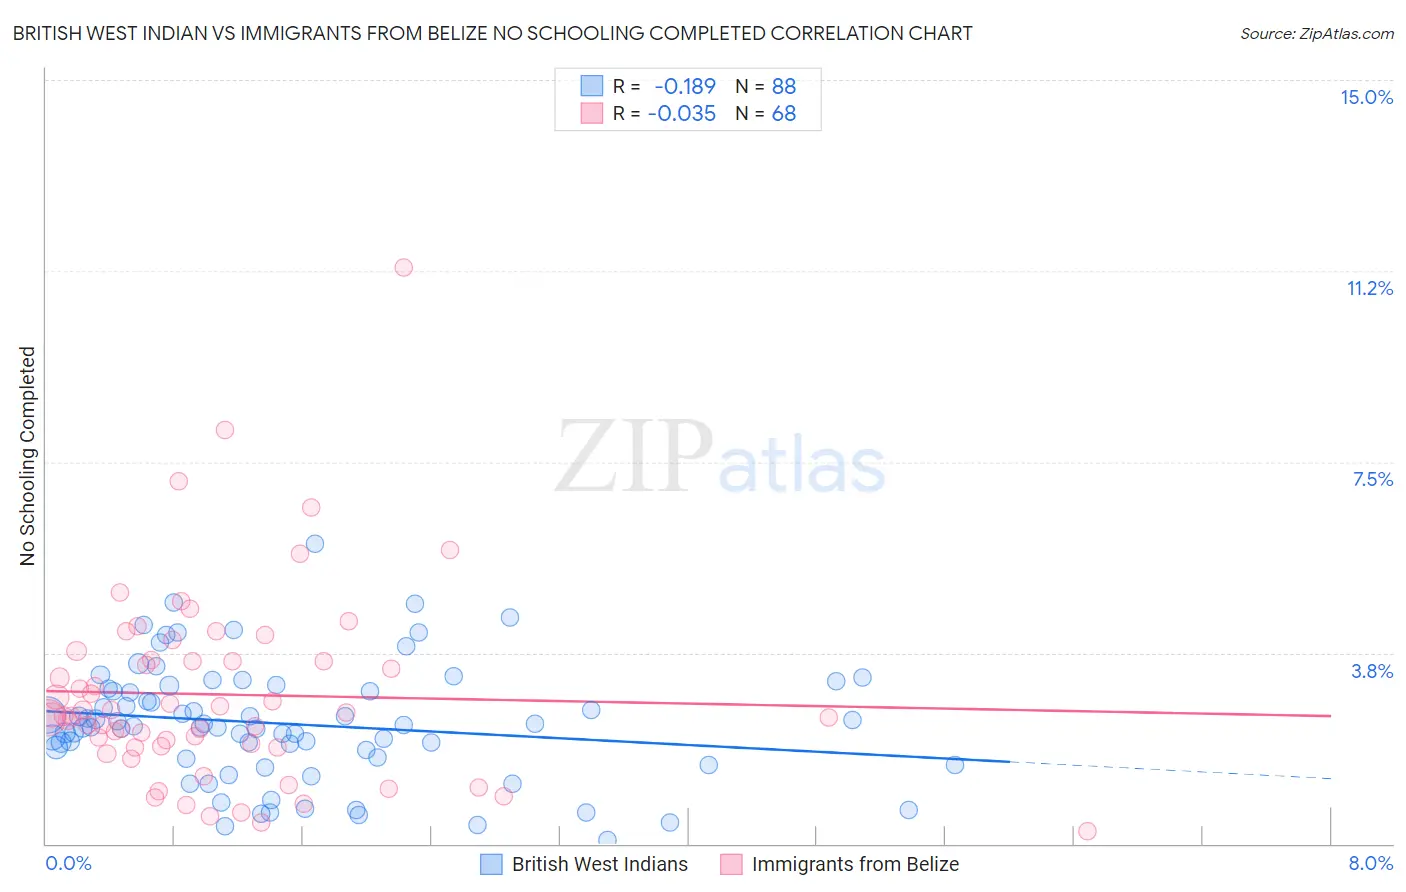
British West Indian vs Immigrants from Belize No Schooling Completed Correlation Chart
The statistical analysis conducted on geographies consisting of 152,295,928 people shows a poor negative correlation between the proportion of British West Indians and percentage of population with no schooling in the United States with a correlation coefficient (R) of -0.189 and weighted average of 2.7%. Similarly, the statistical analysis conducted on geographies consisting of 130,082,075 people shows no correlation between the proportion of Immigrants from Belize and percentage of population with no schooling in the United States with a correlation coefficient (R) of -0.035 and weighted average of 3.1%, a difference of 12.4%.
No Schooling Completed Correlation Summary
| Measurement | British West Indian | Immigrants from Belize |
| Minimum | 0.065% | 0.25% |
| Maximum | 5.9% | 11.3% |
| Range | 5.8% | 11.1% |
| Mean | 2.4% | 2.9% |
| Median | 2.3% | 2.5% |
| Interquartile 25% (IQ1) | 1.7% | 1.9% |
| Interquartile 75% (IQ3) | 3.0% | 3.6% |
| Interquartile Range (IQR) | 1.3% | 1.7% |
| Standard Deviation (Sample) | 1.1% | 1.9% |
| Standard Deviation (Population) | 1.1% | 1.9% |
Similar Demographics by No Schooling Completed
Demographics Similar to British West Indians by No Schooling Completed
In terms of no schooling completed, the demographic groups most similar to British West Indians are Immigrants from Hong Kong (2.7%, a difference of 0.89%), Immigrants from Thailand (2.7%, a difference of 0.95%), Immigrants from Grenada (2.8%, a difference of 1.1%), Immigrants from St. Vincent and the Grenadines (2.7%, a difference of 1.3%), and Immigrants from Afghanistan (2.7%, a difference of 1.4%).
| Demographics | Rating | Rank | No Schooling Completed |
| Immigrants | West Indies | 0.0 /100 | #284 | Tragic 2.7% |
| Immigrants | Barbados | 0.0 /100 | #285 | Tragic 2.7% |
| Immigrants | Portugal | 0.0 /100 | #286 | Tragic 2.7% |
| Immigrants | Afghanistan | 0.0 /100 | #287 | Tragic 2.7% |
| Immigrants | St. Vincent and the Grenadines | 0.0 /100 | #288 | Tragic 2.7% |
| Immigrants | Thailand | 0.0 /100 | #289 | Tragic 2.7% |
| Immigrants | Hong Kong | 0.0 /100 | #290 | Tragic 2.7% |
| British West Indians | 0.0 /100 | #291 | Tragic 2.7% |
| Immigrants | Grenada | 0.0 /100 | #292 | Tragic 2.8% |
| Malaysians | 0.0 /100 | #293 | Tragic 2.8% |
| Immigrants | Eritrea | 0.0 /100 | #294 | Tragic 2.8% |
| Houma | 0.0 /100 | #295 | Tragic 2.8% |
| Immigrants | Immigrants | 0.0 /100 | #296 | Tragic 2.8% |
| Immigrants | Cuba | 0.0 /100 | #297 | Tragic 2.8% |
| Immigrants | Dominica | 0.0 /100 | #298 | Tragic 2.8% |
Demographics Similar to Immigrants from Belize by No Schooling Completed
In terms of no schooling completed, the demographic groups most similar to Immigrants from Belize are Honduran (3.1%, a difference of 0.090%), Immigrants from Nicaragua (3.1%, a difference of 0.24%), Sri Lankan (3.0%, a difference of 0.60%), Immigrants from Ecuador (3.1%, a difference of 0.60%), and Immigrants from the Azores (3.0%, a difference of 0.88%).
| Demographics | Rating | Rank | No Schooling Completed |
| Immigrants | Haiti | 0.0 /100 | #307 | Tragic 3.0% |
| Immigrants | Somalia | 0.0 /100 | #308 | Tragic 3.0% |
| Hispanics or Latinos | 0.0 /100 | #309 | Tragic 3.0% |
| Guyanese | 0.0 /100 | #310 | Tragic 3.0% |
| Immigrants | Azores | 0.0 /100 | #311 | Tragic 3.0% |
| Sri Lankans | 0.0 /100 | #312 | Tragic 3.0% |
| Hondurans | 0.0 /100 | #313 | Tragic 3.1% |
| Immigrants | Belize | 0.0 /100 | #314 | Tragic 3.1% |
| Immigrants | Nicaragua | 0.0 /100 | #315 | Tragic 3.1% |
| Immigrants | Ecuador | 0.0 /100 | #316 | Tragic 3.1% |
| Cape Verdeans | 0.0 /100 | #317 | Tragic 3.1% |
| Immigrants | Guyana | 0.0 /100 | #318 | Tragic 3.1% |
| Immigrants | Burma/Myanmar | 0.0 /100 | #319 | Tragic 3.1% |
| Immigrants | Bangladesh | 0.0 /100 | #320 | Tragic 3.1% |
| Immigrants | Laos | 0.0 /100 | #321 | Tragic 3.1% |