Danish vs Ecuadorian 8th Grade
COMPARE
Danish
Ecuadorian
8th Grade
8th Grade Comparison
Danes
Ecuadorians
97.2%
8TH GRADE
100.0/ 100
METRIC RATING
21st/ 347
METRIC RANK
93.6%
8TH GRADE
0.0/ 100
METRIC RATING
308th/ 347
METRIC RANK
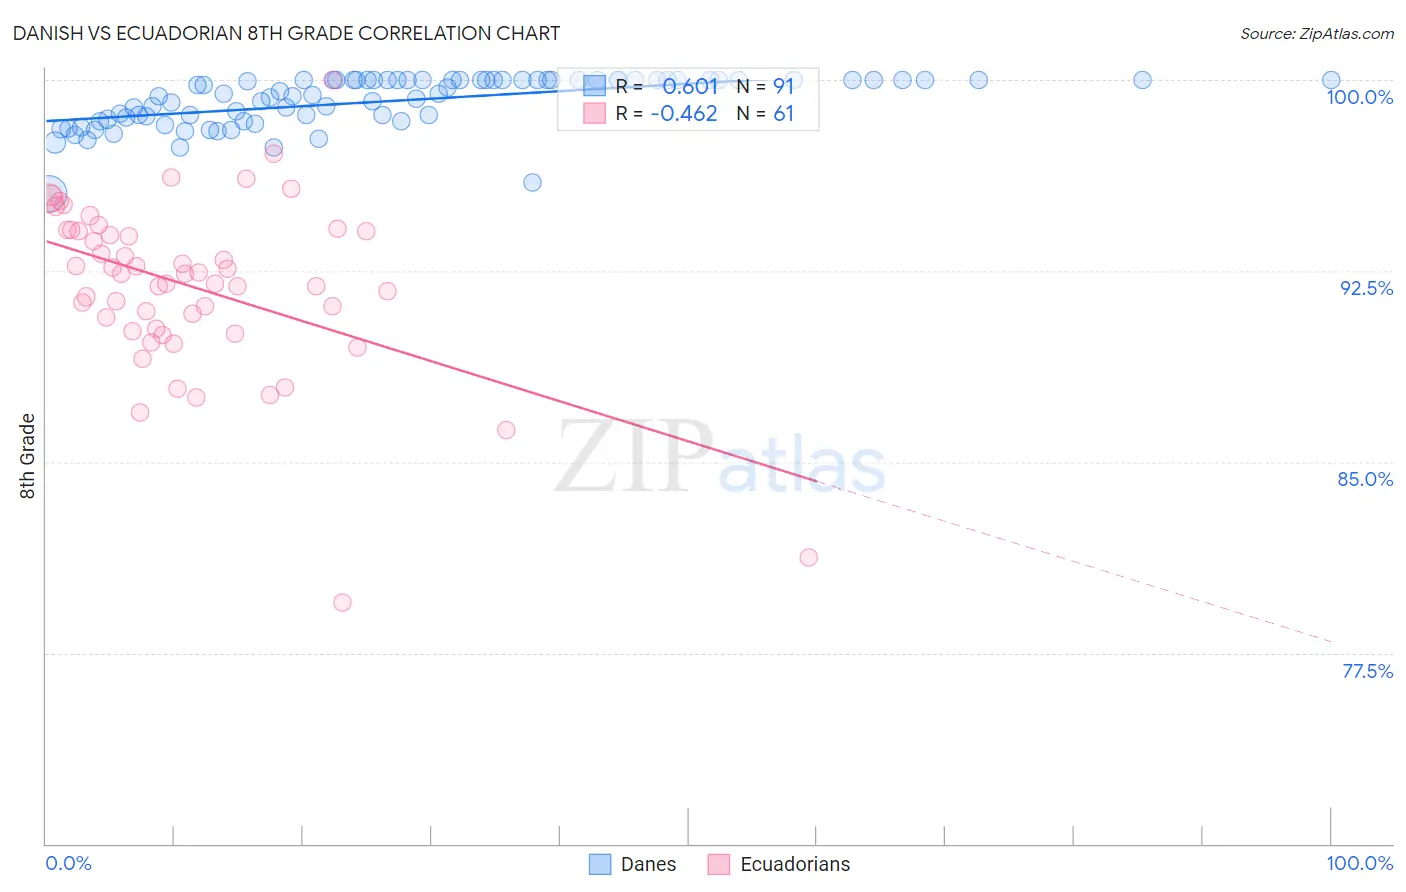
Danish vs Ecuadorian 8th Grade Correlation Chart
The statistical analysis conducted on geographies consisting of 474,193,610 people shows a significant positive correlation between the proportion of Danes and percentage of population with at least 8th grade education in the United States with a correlation coefficient (R) of 0.601 and weighted average of 97.2%. Similarly, the statistical analysis conducted on geographies consisting of 317,753,005 people shows a moderate negative correlation between the proportion of Ecuadorians and percentage of population with at least 8th grade education in the United States with a correlation coefficient (R) of -0.462 and weighted average of 93.6%, a difference of 3.8%.
8th Grade Correlation Summary
| Measurement | Danish | Ecuadorian |
| Minimum | 95.5% | 79.5% |
| Maximum | 100.0% | 100.0% |
| Range | 4.5% | 20.5% |
| Mean | 99.2% | 91.9% |
| Median | 99.5% | 92.4% |
| Interquartile 25% (IQ1) | 98.5% | 90.2% |
| Interquartile 75% (IQ3) | 100.0% | 94.1% |
| Interquartile Range (IQR) | 1.5% | 3.9% |
| Standard Deviation (Sample) | 0.98% | 3.4% |
| Standard Deviation (Population) | 0.98% | 3.4% |
Similar Demographics by 8th Grade
Demographics Similar to Danes by 8th Grade
In terms of 8th grade, the demographic groups most similar to Danes are Croatian (97.2%, a difference of 0.020%), Welsh (97.2%, a difference of 0.030%), French Canadian (97.2%, a difference of 0.030%), Scandinavian (97.2%, a difference of 0.040%), and Czech (97.1%, a difference of 0.050%).
| Demographics | Rating | Rank | 8th Grade |
| English | 100.0 /100 | #14 | Exceptional 97.3% |
| Pennsylvania Germans | 100.0 /100 | #15 | Exceptional 97.3% |
| Tlingit-Haida | 100.0 /100 | #16 | Exceptional 97.3% |
| Irish | 100.0 /100 | #17 | Exceptional 97.3% |
| Lithuanians | 100.0 /100 | #18 | Exceptional 97.3% |
| Scottish | 100.0 /100 | #19 | Exceptional 97.3% |
| Croatians | 100.0 /100 | #20 | Exceptional 97.2% |
| Danes | 100.0 /100 | #21 | Exceptional 97.2% |
| Welsh | 100.0 /100 | #22 | Exceptional 97.2% |
| French Canadians | 100.0 /100 | #23 | Exceptional 97.2% |
| Scandinavians | 100.0 /100 | #24 | Exceptional 97.2% |
| Czechs | 100.0 /100 | #25 | Exceptional 97.1% |
| French | 100.0 /100 | #26 | Exceptional 97.1% |
| Scotch-Irish | 100.0 /100 | #27 | Exceptional 97.1% |
| Italians | 100.0 /100 | #28 | Exceptional 97.1% |
Demographics Similar to Ecuadorians by 8th Grade
In terms of 8th grade, the demographic groups most similar to Ecuadorians are Immigrants (93.6%, a difference of 0.020%), Japanese (93.6%, a difference of 0.030%), Immigrants from Bangladesh (93.6%, a difference of 0.030%), Cape Verdean (93.5%, a difference of 0.070%), and Immigrants from Caribbean (93.5%, a difference of 0.10%).
| Demographics | Rating | Rank | 8th Grade |
| Immigrants | Laos | 0.0 /100 | #301 | Tragic 94.1% |
| Sri Lankans | 0.0 /100 | #302 | Tragic 94.0% |
| Immigrants | Dominica | 0.0 /100 | #303 | Tragic 94.0% |
| Guyanese | 0.0 /100 | #304 | Tragic 93.9% |
| Immigrants | Haiti | 0.0 /100 | #305 | Tragic 93.9% |
| Immigrants | Guyana | 0.0 /100 | #306 | Tragic 93.8% |
| Immigrants | Portugal | 0.0 /100 | #307 | Tragic 93.8% |
| Ecuadorians | 0.0 /100 | #308 | Tragic 93.6% |
| Immigrants | Immigrants | 0.0 /100 | #309 | Tragic 93.6% |
| Japanese | 0.0 /100 | #310 | Tragic 93.6% |
| Immigrants | Bangladesh | 0.0 /100 | #311 | Tragic 93.6% |
| Cape Verdeans | 0.0 /100 | #312 | Tragic 93.5% |
| Immigrants | Caribbean | 0.0 /100 | #313 | Tragic 93.5% |
| Immigrants | Vietnam | 0.0 /100 | #314 | Tragic 93.5% |
| Vietnamese | 0.0 /100 | #315 | Tragic 93.5% |