Hungarian vs Immigrants from China 6th Grade
COMPARE
Hungarian
Immigrants from China
6th Grade
6th Grade Comparison
Hungarians
Immigrants from China
97.8%
6TH GRADE
99.9/ 100
METRIC RATING
42nd/ 347
METRIC RANK
96.4%
6TH GRADE
0.4/ 100
METRIC RATING
258th/ 347
METRIC RANK
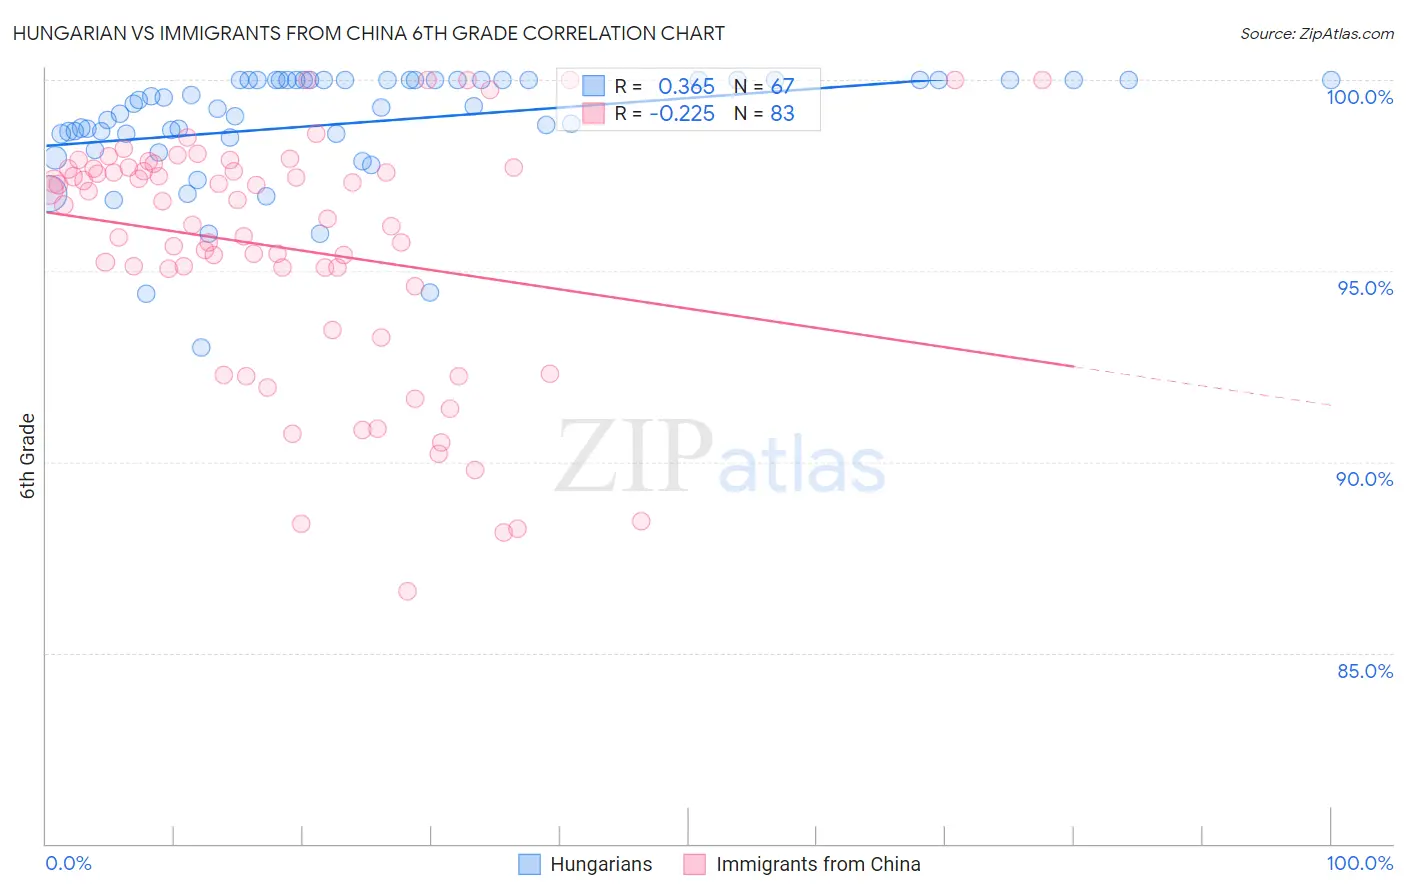
Hungarian vs Immigrants from China 6th Grade Correlation Chart
The statistical analysis conducted on geographies consisting of 486,239,314 people shows a mild positive correlation between the proportion of Hungarians and percentage of population with at least 6th grade education in the United States with a correlation coefficient (R) of 0.365 and weighted average of 97.8%. Similarly, the statistical analysis conducted on geographies consisting of 457,082,957 people shows a weak negative correlation between the proportion of Immigrants from China and percentage of population with at least 6th grade education in the United States with a correlation coefficient (R) of -0.225 and weighted average of 96.4%, a difference of 1.5%.
6th Grade Correlation Summary
| Measurement | Hungarian | Immigrants from China |
| Minimum | 93.0% | 86.6% |
| Maximum | 100.0% | 100.0% |
| Range | 7.0% | 13.4% |
| Mean | 98.9% | 95.6% |
| Median | 99.3% | 96.7% |
| Interquartile 25% (IQ1) | 98.6% | 94.6% |
| Interquartile 75% (IQ3) | 100.0% | 97.7% |
| Interquartile Range (IQR) | 1.4% | 3.1% |
| Standard Deviation (Sample) | 1.5% | 3.2% |
| Standard Deviation (Population) | 1.5% | 3.2% |
Similar Demographics by 6th Grade
Demographics Similar to Hungarians by 6th Grade
In terms of 6th grade, the demographic groups most similar to Hungarians are Eastern European (97.9%, a difference of 0.010%), Northern European (97.8%, a difference of 0.010%), Latvian (97.9%, a difference of 0.040%), Czechoslovakian (97.8%, a difference of 0.040%), and Belgian (97.9%, a difference of 0.050%).
| Demographics | Rating | Rank | 6th Grade |
| Chinese | 100.0 /100 | #35 | Exceptional 97.9% |
| Italians | 100.0 /100 | #36 | Exceptional 97.9% |
| British | 100.0 /100 | #37 | Exceptional 97.9% |
| Belgians | 100.0 /100 | #38 | Exceptional 97.9% |
| Luxembourgers | 99.9 /100 | #39 | Exceptional 97.9% |
| Latvians | 99.9 /100 | #40 | Exceptional 97.9% |
| Eastern Europeans | 99.9 /100 | #41 | Exceptional 97.9% |
| Hungarians | 99.9 /100 | #42 | Exceptional 97.8% |
| Northern Europeans | 99.9 /100 | #43 | Exceptional 97.8% |
| Czechoslovakians | 99.9 /100 | #44 | Exceptional 97.8% |
| Bulgarians | 99.9 /100 | #45 | Exceptional 97.8% |
| Arapaho | 99.9 /100 | #46 | Exceptional 97.8% |
| Native Hawaiians | 99.9 /100 | #47 | Exceptional 97.8% |
| Celtics | 99.9 /100 | #48 | Exceptional 97.8% |
| Estonians | 99.8 /100 | #49 | Exceptional 97.8% |
Demographics Similar to Immigrants from China by 6th Grade
In terms of 6th grade, the demographic groups most similar to Immigrants from China are South American (96.4%, a difference of 0.0%), Taiwanese (96.5%, a difference of 0.010%), Peruvian (96.4%, a difference of 0.010%), Immigrants from Sierra Leone (96.4%, a difference of 0.010%), and Immigrants from Ethiopia (96.5%, a difference of 0.030%).
| Demographics | Rating | Rank | 6th Grade |
| Immigrants | Senegal | 0.7 /100 | #251 | Tragic 96.5% |
| Immigrants | Uruguay | 0.6 /100 | #252 | Tragic 96.5% |
| Jamaicans | 0.6 /100 | #253 | Tragic 96.5% |
| Immigrants | Ethiopia | 0.6 /100 | #254 | Tragic 96.5% |
| Immigrants | Congo | 0.6 /100 | #255 | Tragic 96.5% |
| U.S. Virgin Islanders | 0.5 /100 | #256 | Tragic 96.5% |
| Taiwanese | 0.5 /100 | #257 | Tragic 96.5% |
| Immigrants | China | 0.4 /100 | #258 | Tragic 96.4% |
| South Americans | 0.4 /100 | #259 | Tragic 96.4% |
| Peruvians | 0.4 /100 | #260 | Tragic 96.4% |
| Immigrants | Sierra Leone | 0.4 /100 | #261 | Tragic 96.4% |
| Immigrants | Nigeria | 0.3 /100 | #262 | Tragic 96.4% |
| Immigrants | Colombia | 0.3 /100 | #263 | Tragic 96.4% |
| Armenians | 0.3 /100 | #264 | Tragic 96.4% |
| Immigrants | Jamaica | 0.2 /100 | #265 | Tragic 96.4% |