Immigrants from Western Africa vs Immigrants from China 6th Grade
COMPARE
Immigrants from Western Africa
Immigrants from China
6th Grade
6th Grade Comparison
Immigrants from Western Africa
Immigrants from China
96.3%
6TH GRADE
0.1/ 100
METRIC RATING
277th/ 347
METRIC RANK
96.4%
6TH GRADE
0.4/ 100
METRIC RATING
258th/ 347
METRIC RANK
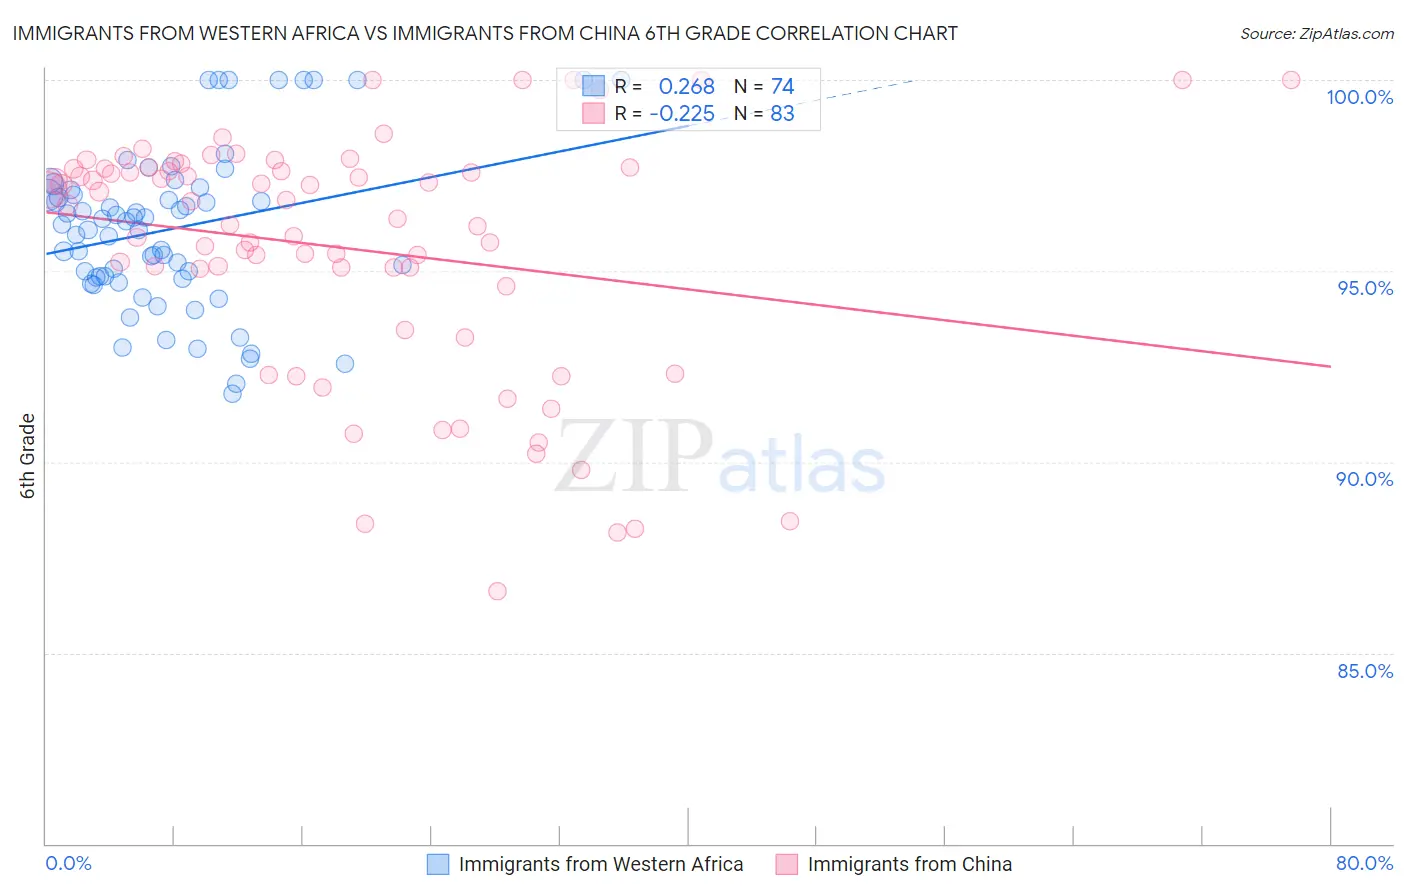
Immigrants from Western Africa vs Immigrants from China 6th Grade Correlation Chart
The statistical analysis conducted on geographies consisting of 357,809,696 people shows a weak positive correlation between the proportion of Immigrants from Western Africa and percentage of population with at least 6th grade education in the United States with a correlation coefficient (R) of 0.268 and weighted average of 96.3%. Similarly, the statistical analysis conducted on geographies consisting of 457,082,957 people shows a weak negative correlation between the proportion of Immigrants from China and percentage of population with at least 6th grade education in the United States with a correlation coefficient (R) of -0.225 and weighted average of 96.4%, a difference of 0.19%.
6th Grade Correlation Summary
| Measurement | Immigrants from Western Africa | Immigrants from China |
| Minimum | 91.8% | 86.6% |
| Maximum | 100.0% | 100.0% |
| Range | 8.2% | 13.4% |
| Mean | 96.1% | 95.6% |
| Median | 96.3% | 96.7% |
| Interquartile 25% (IQ1) | 94.8% | 94.6% |
| Interquartile 75% (IQ3) | 97.1% | 97.7% |
| Interquartile Range (IQR) | 2.3% | 3.1% |
| Standard Deviation (Sample) | 2.1% | 3.2% |
| Standard Deviation (Population) | 2.1% | 3.2% |
Demographics Similar to Immigrants from Western Africa and Immigrants from China by 6th Grade
In terms of 6th grade, the demographic groups most similar to Immigrants from Western Africa are Yaqui (96.3%, a difference of 0.010%), Immigrants from Ghana (96.3%, a difference of 0.020%), Immigrants from Cameroon (96.3%, a difference of 0.030%), Immigrants from Philippines (96.3%, a difference of 0.030%), and Immigrants from Bolivia (96.3%, a difference of 0.040%). Similarly, the demographic groups most similar to Immigrants from China are South American (96.4%, a difference of 0.0%), Taiwanese (96.5%, a difference of 0.010%), Peruvian (96.4%, a difference of 0.010%), Immigrants from Sierra Leone (96.4%, a difference of 0.010%), and Immigrants from Nigeria (96.4%, a difference of 0.050%).
| Demographics | Rating | Rank | 6th Grade |
| Taiwanese | 0.5 /100 | #257 | Tragic 96.5% |
| Immigrants | China | 0.4 /100 | #258 | Tragic 96.4% |
| South Americans | 0.4 /100 | #259 | Tragic 96.4% |
| Peruvians | 0.4 /100 | #260 | Tragic 96.4% |
| Immigrants | Sierra Leone | 0.4 /100 | #261 | Tragic 96.4% |
| Immigrants | Nigeria | 0.3 /100 | #262 | Tragic 96.4% |
| Immigrants | Colombia | 0.3 /100 | #263 | Tragic 96.4% |
| Armenians | 0.3 /100 | #264 | Tragic 96.4% |
| Immigrants | Jamaica | 0.2 /100 | #265 | Tragic 96.4% |
| Ghanaians | 0.2 /100 | #266 | Tragic 96.4% |
| Afghans | 0.2 /100 | #267 | Tragic 96.4% |
| Immigrants | Uzbekistan | 0.2 /100 | #268 | Tragic 96.3% |
| West Indians | 0.2 /100 | #269 | Tragic 96.3% |
| Immigrants | South America | 0.2 /100 | #270 | Tragic 96.3% |
| Immigrants | Hong Kong | 0.2 /100 | #271 | Tragic 96.3% |
| Immigrants | Bolivia | 0.1 /100 | #272 | Tragic 96.3% |
| Immigrants | Cameroon | 0.1 /100 | #273 | Tragic 96.3% |
| Immigrants | Philippines | 0.1 /100 | #274 | Tragic 96.3% |
| Immigrants | Ghana | 0.1 /100 | #275 | Tragic 96.3% |
| Yaqui | 0.1 /100 | #276 | Tragic 96.3% |
| Immigrants | Western Africa | 0.1 /100 | #277 | Tragic 96.3% |