Portuguese vs Immigrants from Colombia Doctorate Degree
COMPARE
Portuguese
Immigrants from Colombia
Doctorate Degree
Doctorate Degree Comparison
Portuguese
Immigrants from Colombia
1.8%
DOCTORATE DEGREE
21.4/ 100
METRIC RATING
202nd/ 347
METRIC RANK
1.7%
DOCTORATE DEGREE
6.7/ 100
METRIC RATING
225th/ 347
METRIC RANK
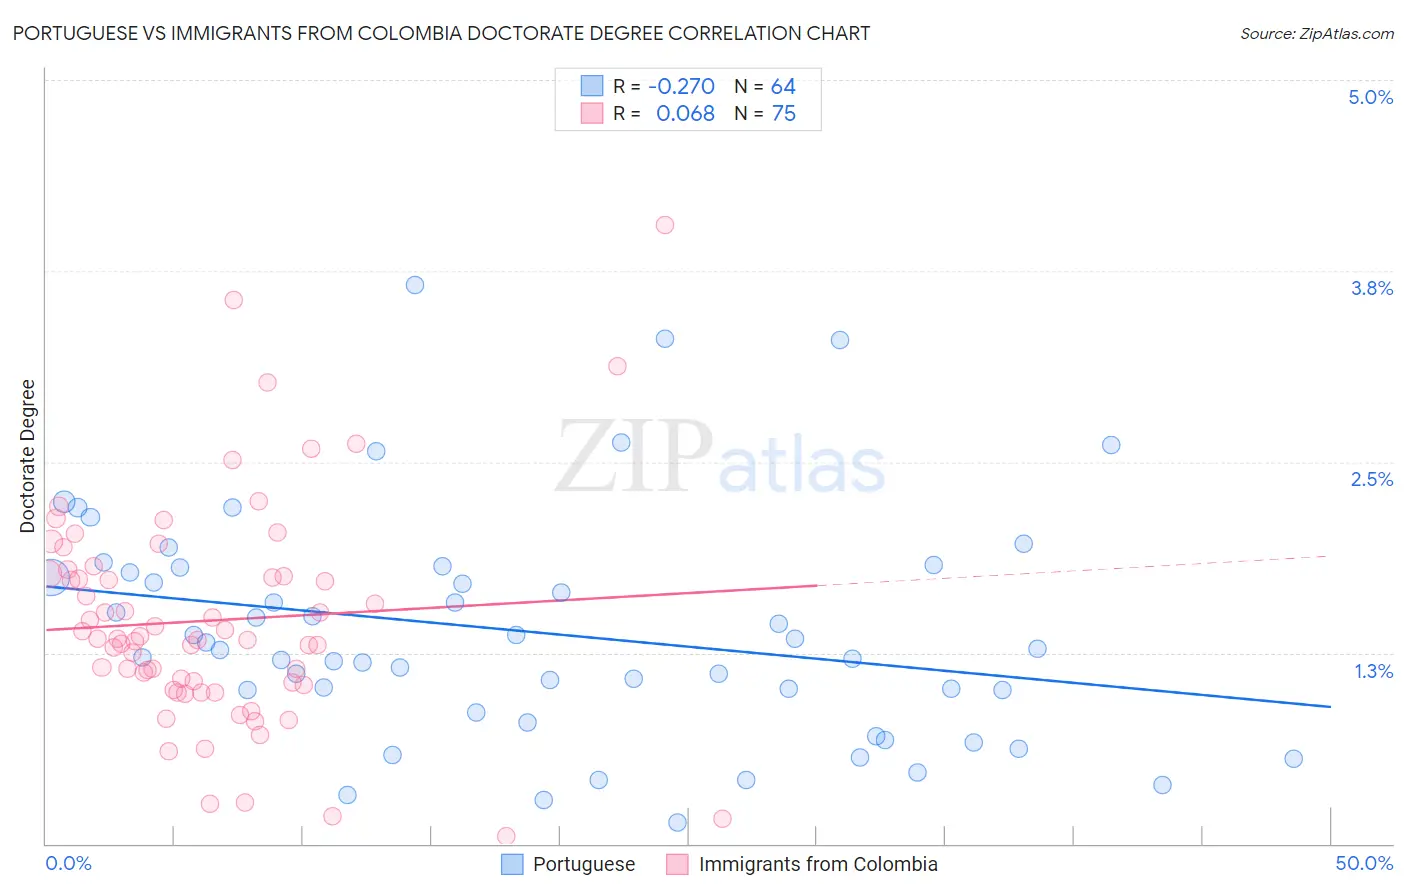
Portuguese vs Immigrants from Colombia Doctorate Degree Correlation Chart
The statistical analysis conducted on geographies consisting of 443,772,910 people shows a weak negative correlation between the proportion of Portuguese and percentage of population with at least doctorate degree education in the United States with a correlation coefficient (R) of -0.270 and weighted average of 1.8%. Similarly, the statistical analysis conducted on geographies consisting of 375,852,559 people shows a slight positive correlation between the proportion of Immigrants from Colombia and percentage of population with at least doctorate degree education in the United States with a correlation coefficient (R) of 0.068 and weighted average of 1.7%, a difference of 5.4%.
Doctorate Degree Correlation Summary
| Measurement | Portuguese | Immigrants from Colombia |
| Minimum | 0.14% | 0.049% |
| Maximum | 3.7% | 4.1% |
| Range | 3.5% | 4.0% |
| Mean | 1.4% | 1.5% |
| Median | 1.3% | 1.3% |
| Interquartile 25% (IQ1) | 0.93% | 1.0% |
| Interquartile 75% (IQ3) | 1.8% | 1.8% |
| Interquartile Range (IQR) | 0.86% | 0.73% |
| Standard Deviation (Sample) | 0.75% | 0.73% |
| Standard Deviation (Population) | 0.74% | 0.72% |
Similar Demographics by Doctorate Degree
Demographics Similar to Portuguese by Doctorate Degree
In terms of doctorate degree, the demographic groups most similar to Portuguese are Immigrants from Vietnam (1.8%, a difference of 0.020%), Somali (1.7%, a difference of 0.050%), Immigrants from Nigeria (1.8%, a difference of 0.23%), White/Caucasian (1.8%, a difference of 0.29%), and Immigrants from South America (1.8%, a difference of 0.40%).
| Demographics | Rating | Rank | Doctorate Degree |
| Immigrants | Somalia | 25.4 /100 | #195 | Fair 1.8% |
| Sub-Saharan Africans | 25.1 /100 | #196 | Fair 1.8% |
| Chinese | 25.1 /100 | #197 | Fair 1.8% |
| Immigrants | Ghana | 24.6 /100 | #198 | Fair 1.8% |
| Immigrants | South America | 23.3 /100 | #199 | Fair 1.8% |
| Whites/Caucasians | 22.8 /100 | #200 | Fair 1.8% |
| Immigrants | Nigeria | 22.4 /100 | #201 | Fair 1.8% |
| Portuguese | 21.4 /100 | #202 | Fair 1.8% |
| Immigrants | Vietnam | 21.4 /100 | #203 | Fair 1.8% |
| Somalis | 21.2 /100 | #204 | Fair 1.7% |
| Venezuelans | 19.5 /100 | #205 | Poor 1.7% |
| Immigrants | Peru | 17.6 /100 | #206 | Poor 1.7% |
| Yugoslavians | 17.1 /100 | #207 | Poor 1.7% |
| Colombians | 16.1 /100 | #208 | Poor 1.7% |
| Immigrants | Western Africa | 15.4 /100 | #209 | Poor 1.7% |
Demographics Similar to Immigrants from Colombia by Doctorate Degree
In terms of doctorate degree, the demographic groups most similar to Immigrants from Colombia are Osage (1.7%, a difference of 0.12%), Panamanian (1.7%, a difference of 0.26%), Immigrants from Poland (1.7%, a difference of 0.49%), Assyrian/Chaldean/Syriac (1.7%, a difference of 0.53%), and Immigrants from Bosnia and Herzegovina (1.7%, a difference of 0.71%).
| Demographics | Rating | Rank | Doctorate Degree |
| Tlingit-Haida | 11.9 /100 | #218 | Poor 1.7% |
| Immigrants | Iraq | 10.7 /100 | #219 | Poor 1.7% |
| Immigrants | Uruguay | 9.2 /100 | #220 | Tragic 1.7% |
| Immigrants | Nonimmigrants | 8.8 /100 | #221 | Tragic 1.7% |
| Immigrants | Venezuela | 8.7 /100 | #222 | Tragic 1.7% |
| Immigrants | Bosnia and Herzegovina | 7.8 /100 | #223 | Tragic 1.7% |
| Immigrants | Poland | 7.4 /100 | #224 | Tragic 1.7% |
| Immigrants | Colombia | 6.7 /100 | #225 | Tragic 1.7% |
| Osage | 6.5 /100 | #226 | Tragic 1.7% |
| Panamanians | 6.3 /100 | #227 | Tragic 1.7% |
| Assyrians/Chaldeans/Syriacs | 5.9 /100 | #228 | Tragic 1.7% |
| Colville | 4.7 /100 | #229 | Tragic 1.6% |
| Immigrants | Philippines | 4.3 /100 | #230 | Tragic 1.6% |
| Immigrants | North Macedonia | 3.9 /100 | #231 | Tragic 1.6% |
| Guamanians/Chamorros | 3.3 /100 | #232 | Tragic 1.6% |