Immigrants from Ireland vs Immigrants from Colombia Doctorate Degree
COMPARE
Immigrants from Ireland
Immigrants from Colombia
Doctorate Degree
Doctorate Degree Comparison
Immigrants from Ireland
Immigrants from Colombia
2.5%
DOCTORATE DEGREE
100.0/ 100
METRIC RATING
39th/ 347
METRIC RANK
1.7%
DOCTORATE DEGREE
6.7/ 100
METRIC RATING
225th/ 347
METRIC RANK
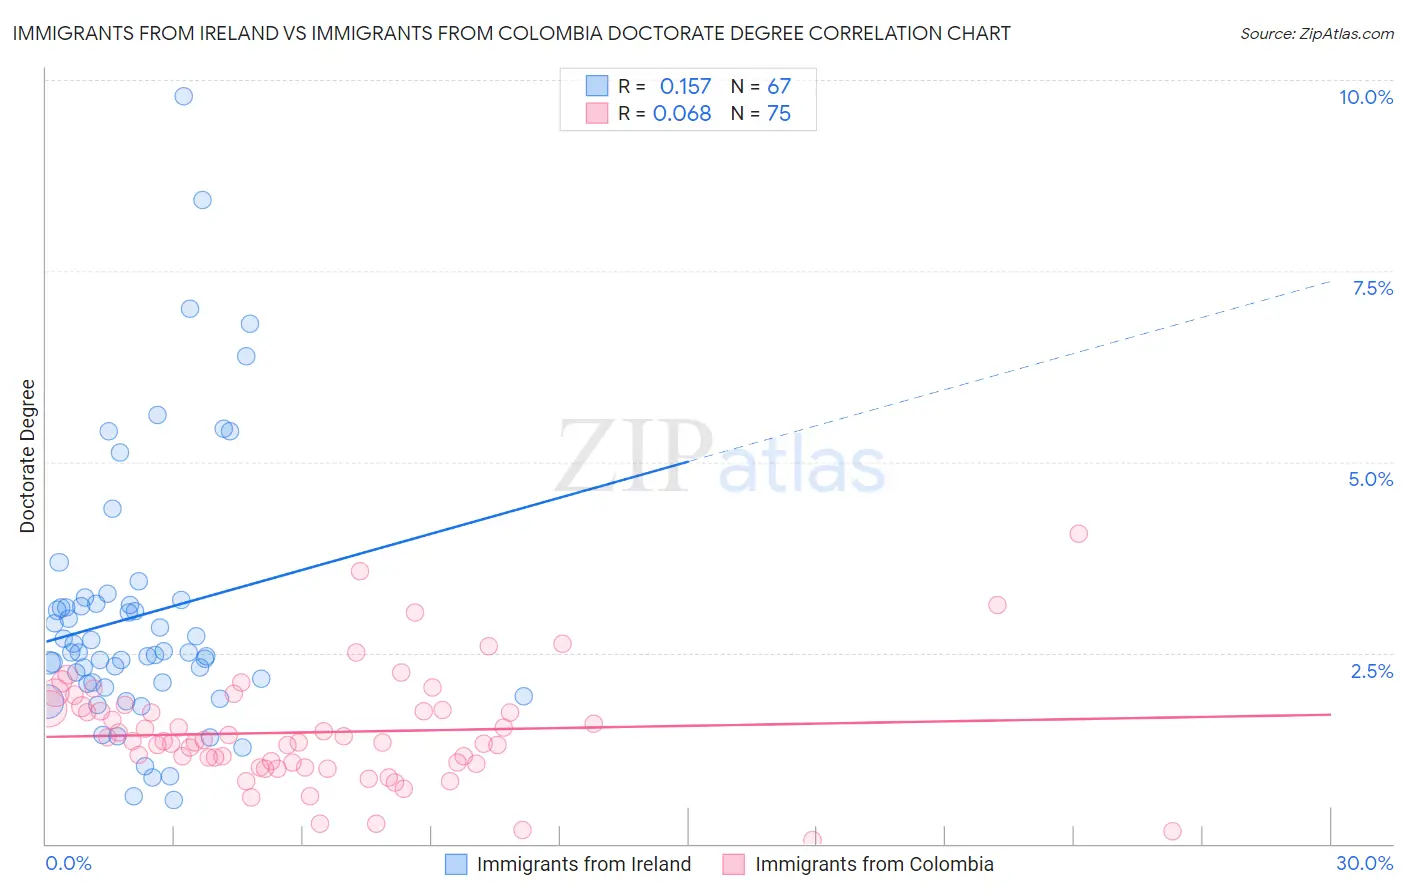
Immigrants from Ireland vs Immigrants from Colombia Doctorate Degree Correlation Chart
The statistical analysis conducted on geographies consisting of 240,028,827 people shows a poor positive correlation between the proportion of Immigrants from Ireland and percentage of population with at least doctorate degree education in the United States with a correlation coefficient (R) of 0.157 and weighted average of 2.5%. Similarly, the statistical analysis conducted on geographies consisting of 375,852,559 people shows a slight positive correlation between the proportion of Immigrants from Colombia and percentage of population with at least doctorate degree education in the United States with a correlation coefficient (R) of 0.068 and weighted average of 1.7%, a difference of 52.9%.
Doctorate Degree Correlation Summary
| Measurement | Immigrants from Ireland | Immigrants from Colombia |
| Minimum | 0.58% | 0.049% |
| Maximum | 9.8% | 4.1% |
| Range | 9.2% | 4.0% |
| Mean | 3.0% | 1.5% |
| Median | 2.5% | 1.3% |
| Interquartile 25% (IQ1) | 2.1% | 1.0% |
| Interquartile 75% (IQ3) | 3.1% | 1.8% |
| Interquartile Range (IQR) | 1.0% | 0.73% |
| Standard Deviation (Sample) | 1.8% | 0.73% |
| Standard Deviation (Population) | 1.7% | 0.72% |
Similar Demographics by Doctorate Degree
Demographics Similar to Immigrants from Ireland by Doctorate Degree
In terms of doctorate degree, the demographic groups most similar to Immigrants from Ireland are Estonian (2.5%, a difference of 0.41%), Russian (2.6%, a difference of 0.49%), Immigrants from Kuwait (2.6%, a difference of 0.65%), Immigrants from Russia (2.5%, a difference of 0.74%), and Immigrants from Spain (2.6%, a difference of 0.92%).
| Demographics | Rating | Rank | Doctorate Degree |
| Immigrants | Northern Europe | 100.0 /100 | #32 | Exceptional 2.6% |
| Cambodians | 100.0 /100 | #33 | Exceptional 2.6% |
| Cypriots | 100.0 /100 | #34 | Exceptional 2.6% |
| Immigrants | Malaysia | 100.0 /100 | #35 | Exceptional 2.6% |
| Immigrants | Spain | 100.0 /100 | #36 | Exceptional 2.6% |
| Immigrants | Kuwait | 100.0 /100 | #37 | Exceptional 2.6% |
| Russians | 100.0 /100 | #38 | Exceptional 2.6% |
| Immigrants | Ireland | 100.0 /100 | #39 | Exceptional 2.5% |
| Estonians | 100.0 /100 | #40 | Exceptional 2.5% |
| Immigrants | Russia | 100.0 /100 | #41 | Exceptional 2.5% |
| New Zealanders | 100.0 /100 | #42 | Exceptional 2.5% |
| Soviet Union | 100.0 /100 | #43 | Exceptional 2.5% |
| Immigrants | Netherlands | 100.0 /100 | #44 | Exceptional 2.5% |
| Immigrants | South Africa | 100.0 /100 | #45 | Exceptional 2.4% |
| Immigrants | Austria | 100.0 /100 | #46 | Exceptional 2.4% |
Demographics Similar to Immigrants from Colombia by Doctorate Degree
In terms of doctorate degree, the demographic groups most similar to Immigrants from Colombia are Osage (1.7%, a difference of 0.12%), Panamanian (1.7%, a difference of 0.26%), Immigrants from Poland (1.7%, a difference of 0.49%), Assyrian/Chaldean/Syriac (1.7%, a difference of 0.53%), and Immigrants from Bosnia and Herzegovina (1.7%, a difference of 0.71%).
| Demographics | Rating | Rank | Doctorate Degree |
| Tlingit-Haida | 11.9 /100 | #218 | Poor 1.7% |
| Immigrants | Iraq | 10.7 /100 | #219 | Poor 1.7% |
| Immigrants | Uruguay | 9.2 /100 | #220 | Tragic 1.7% |
| Immigrants | Nonimmigrants | 8.8 /100 | #221 | Tragic 1.7% |
| Immigrants | Venezuela | 8.7 /100 | #222 | Tragic 1.7% |
| Immigrants | Bosnia and Herzegovina | 7.8 /100 | #223 | Tragic 1.7% |
| Immigrants | Poland | 7.4 /100 | #224 | Tragic 1.7% |
| Immigrants | Colombia | 6.7 /100 | #225 | Tragic 1.7% |
| Osage | 6.5 /100 | #226 | Tragic 1.7% |
| Panamanians | 6.3 /100 | #227 | Tragic 1.7% |
| Assyrians/Chaldeans/Syriacs | 5.9 /100 | #228 | Tragic 1.7% |
| Colville | 4.7 /100 | #229 | Tragic 1.6% |
| Immigrants | Philippines | 4.3 /100 | #230 | Tragic 1.6% |
| Immigrants | North Macedonia | 3.9 /100 | #231 | Tragic 1.6% |
| Guamanians/Chamorros | 3.3 /100 | #232 | Tragic 1.6% |