Zimbabwean vs Immigrants from Colombia Doctorate Degree
COMPARE
Zimbabwean
Immigrants from Colombia
Doctorate Degree
Doctorate Degree Comparison
Zimbabweans
Immigrants from Colombia
2.3%
DOCTORATE DEGREE
99.8/ 100
METRIC RATING
67th/ 347
METRIC RANK
1.7%
DOCTORATE DEGREE
6.7/ 100
METRIC RATING
225th/ 347
METRIC RANK
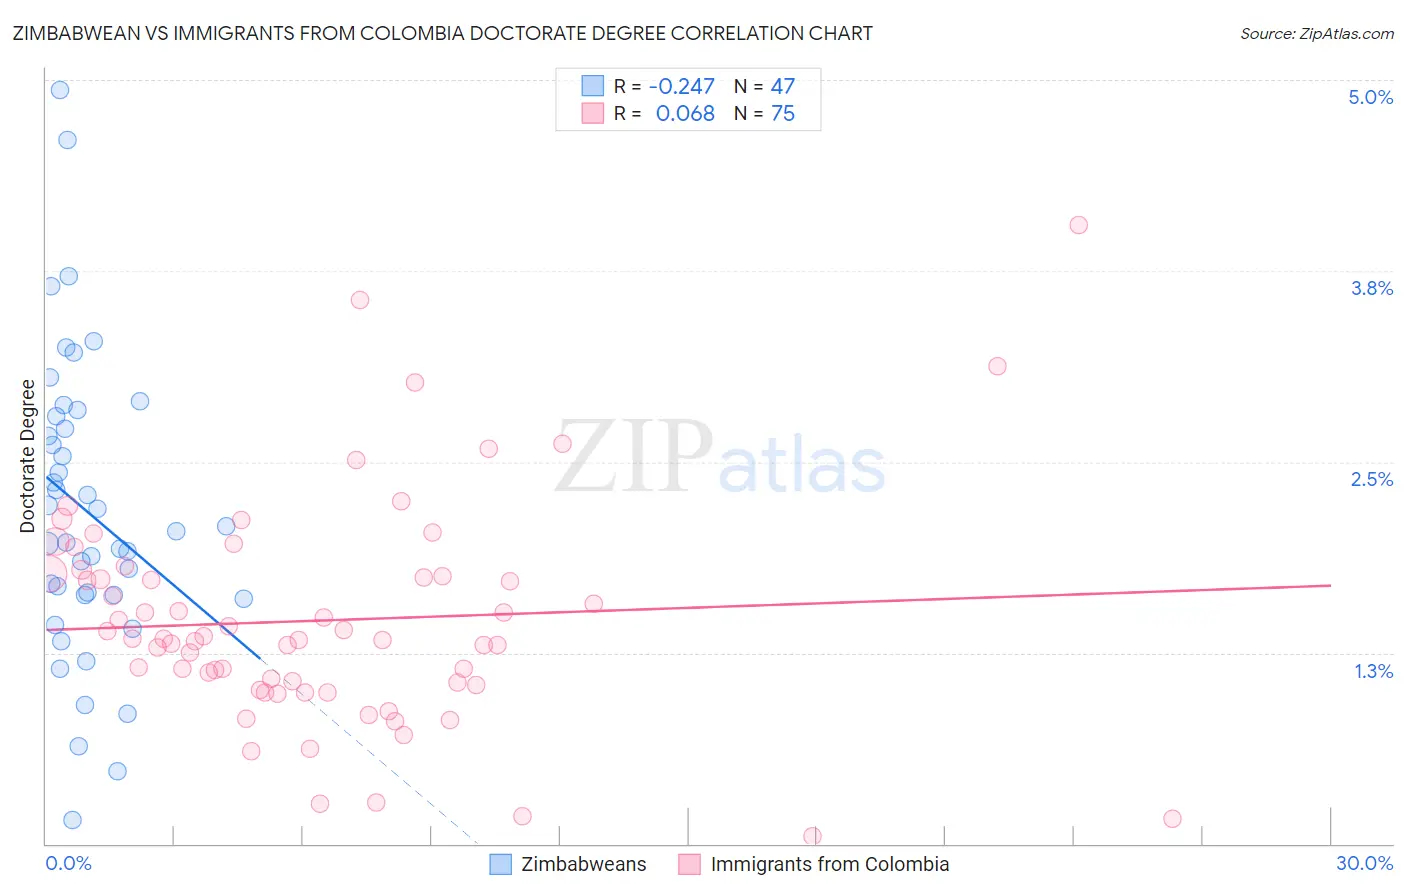
Zimbabwean vs Immigrants from Colombia Doctorate Degree Correlation Chart
The statistical analysis conducted on geographies consisting of 69,036,010 people shows a weak negative correlation between the proportion of Zimbabweans and percentage of population with at least doctorate degree education in the United States with a correlation coefficient (R) of -0.247 and weighted average of 2.3%. Similarly, the statistical analysis conducted on geographies consisting of 375,852,559 people shows a slight positive correlation between the proportion of Immigrants from Colombia and percentage of population with at least doctorate degree education in the United States with a correlation coefficient (R) of 0.068 and weighted average of 1.7%, a difference of 36.8%.
Doctorate Degree Correlation Summary
| Measurement | Zimbabwean | Immigrants from Colombia |
| Minimum | 0.16% | 0.049% |
| Maximum | 4.9% | 4.1% |
| Range | 4.8% | 4.0% |
| Mean | 2.2% | 1.5% |
| Median | 2.0% | 1.3% |
| Interquartile 25% (IQ1) | 1.6% | 1.0% |
| Interquartile 75% (IQ3) | 2.8% | 1.8% |
| Interquartile Range (IQR) | 1.2% | 0.73% |
| Standard Deviation (Sample) | 0.98% | 0.73% |
| Standard Deviation (Population) | 0.97% | 0.72% |
Similar Demographics by Doctorate Degree
Demographics Similar to Zimbabweans by Doctorate Degree
In terms of doctorate degree, the demographic groups most similar to Zimbabweans are Immigrants from Kazakhstan (2.3%, a difference of 0.23%), Argentinean (2.3%, a difference of 0.46%), Carpatho Rusyn (2.3%, a difference of 0.48%), Lithuanian (2.3%, a difference of 0.62%), and Immigrants from Bolivia (2.3%, a difference of 0.62%).
| Demographics | Rating | Rank | Doctorate Degree |
| Immigrants | Serbia | 99.9 /100 | #60 | Exceptional 2.3% |
| Bhutanese | 99.9 /100 | #61 | Exceptional 2.3% |
| Immigrants | Europe | 99.9 /100 | #62 | Exceptional 2.3% |
| Laotians | 99.9 /100 | #63 | Exceptional 2.3% |
| Immigrants | Greece | 99.9 /100 | #64 | Exceptional 2.3% |
| Paraguayans | 99.9 /100 | #65 | Exceptional 2.3% |
| Argentineans | 99.9 /100 | #66 | Exceptional 2.3% |
| Zimbabweans | 99.8 /100 | #67 | Exceptional 2.3% |
| Immigrants | Kazakhstan | 99.8 /100 | #68 | Exceptional 2.3% |
| Carpatho Rusyns | 99.8 /100 | #69 | Exceptional 2.3% |
| Lithuanians | 99.8 /100 | #70 | Exceptional 2.3% |
| Immigrants | Bolivia | 99.8 /100 | #71 | Exceptional 2.3% |
| Immigrants | Canada | 99.8 /100 | #72 | Exceptional 2.3% |
| Immigrants | Bulgaria | 99.8 /100 | #73 | Exceptional 2.3% |
| Immigrants | North America | 99.8 /100 | #74 | Exceptional 2.2% |
Demographics Similar to Immigrants from Colombia by Doctorate Degree
In terms of doctorate degree, the demographic groups most similar to Immigrants from Colombia are Osage (1.7%, a difference of 0.12%), Panamanian (1.7%, a difference of 0.26%), Immigrants from Poland (1.7%, a difference of 0.49%), Assyrian/Chaldean/Syriac (1.7%, a difference of 0.53%), and Immigrants from Bosnia and Herzegovina (1.7%, a difference of 0.71%).
| Demographics | Rating | Rank | Doctorate Degree |
| Tlingit-Haida | 11.9 /100 | #218 | Poor 1.7% |
| Immigrants | Iraq | 10.7 /100 | #219 | Poor 1.7% |
| Immigrants | Uruguay | 9.2 /100 | #220 | Tragic 1.7% |
| Immigrants | Nonimmigrants | 8.8 /100 | #221 | Tragic 1.7% |
| Immigrants | Venezuela | 8.7 /100 | #222 | Tragic 1.7% |
| Immigrants | Bosnia and Herzegovina | 7.8 /100 | #223 | Tragic 1.7% |
| Immigrants | Poland | 7.4 /100 | #224 | Tragic 1.7% |
| Immigrants | Colombia | 6.7 /100 | #225 | Tragic 1.7% |
| Osage | 6.5 /100 | #226 | Tragic 1.7% |
| Panamanians | 6.3 /100 | #227 | Tragic 1.7% |
| Assyrians/Chaldeans/Syriacs | 5.9 /100 | #228 | Tragic 1.7% |
| Colville | 4.7 /100 | #229 | Tragic 1.6% |
| Immigrants | Philippines | 4.3 /100 | #230 | Tragic 1.6% |
| Immigrants | North Macedonia | 3.9 /100 | #231 | Tragic 1.6% |
| Guamanians/Chamorros | 3.3 /100 | #232 | Tragic 1.6% |