Portuguese vs Nigerian Doctorate Degree
COMPARE
Portuguese
Nigerian
Doctorate Degree
Doctorate Degree Comparison
Portuguese
Nigerians
1.8%
DOCTORATE DEGREE
21.4/ 100
METRIC RATING
202nd/ 347
METRIC RANK
1.8%
DOCTORATE DEGREE
39.9/ 100
METRIC RATING
184th/ 347
METRIC RANK
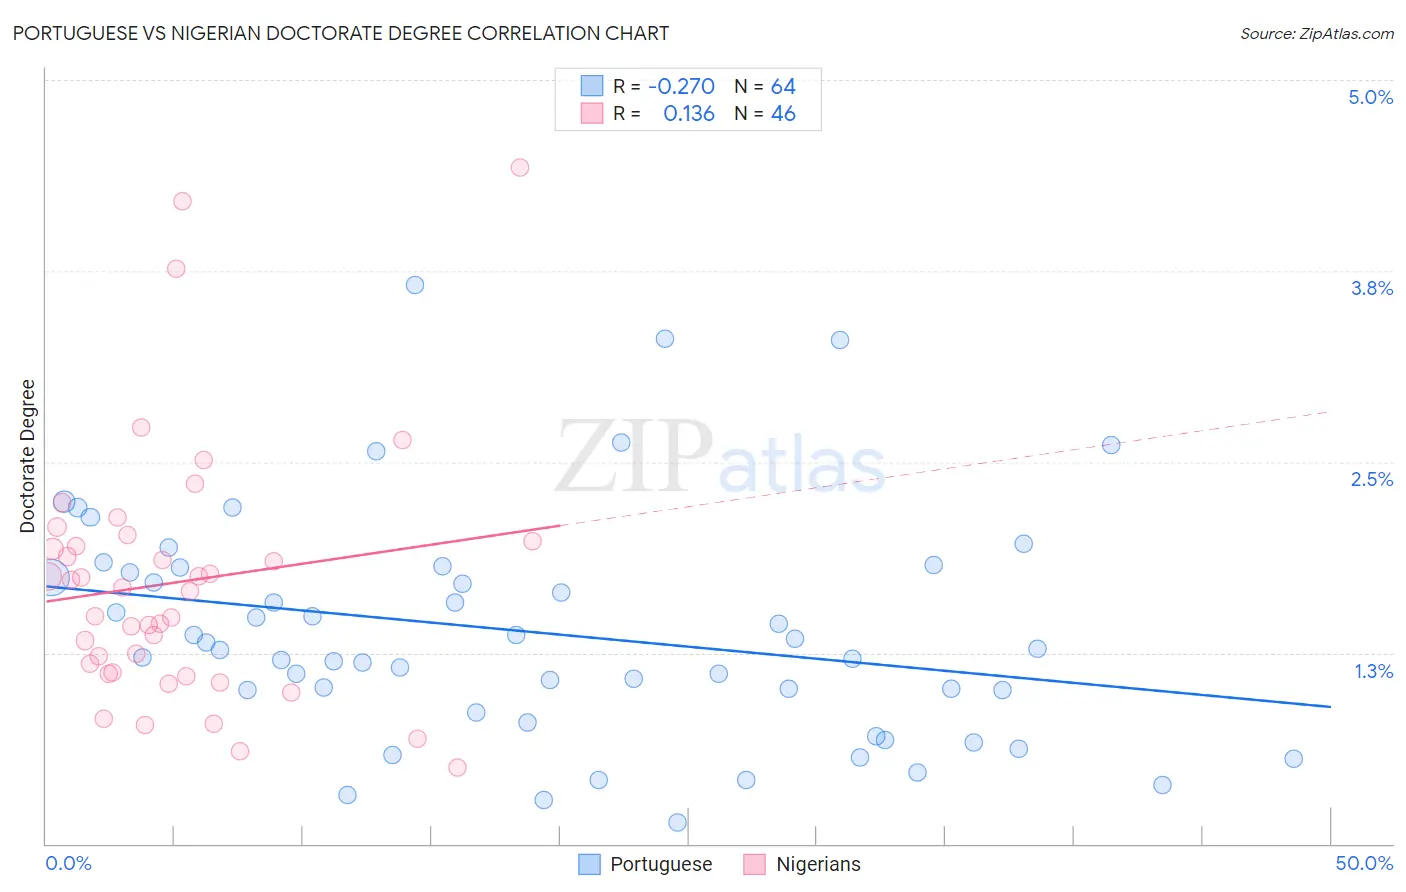
Portuguese vs Nigerian Doctorate Degree Correlation Chart
The statistical analysis conducted on geographies consisting of 443,772,910 people shows a weak negative correlation between the proportion of Portuguese and percentage of population with at least doctorate degree education in the United States with a correlation coefficient (R) of -0.270 and weighted average of 1.8%. Similarly, the statistical analysis conducted on geographies consisting of 330,548,199 people shows a poor positive correlation between the proportion of Nigerians and percentage of population with at least doctorate degree education in the United States with a correlation coefficient (R) of 0.136 and weighted average of 1.8%, a difference of 3.4%.
Doctorate Degree Correlation Summary
| Measurement | Portuguese | Nigerian |
| Minimum | 0.14% | 0.50% |
| Maximum | 3.7% | 4.4% |
| Range | 3.5% | 3.9% |
| Mean | 1.4% | 1.7% |
| Median | 1.3% | 1.7% |
| Interquartile 25% (IQ1) | 0.93% | 1.1% |
| Interquartile 75% (IQ3) | 1.8% | 2.0% |
| Interquartile Range (IQR) | 0.86% | 0.87% |
| Standard Deviation (Sample) | 0.75% | 0.84% |
| Standard Deviation (Population) | 0.74% | 0.83% |
Demographics Similar to Portuguese and Nigerians by Doctorate Degree
In terms of doctorate degree, the demographic groups most similar to Portuguese are Immigrants from Vietnam (1.8%, a difference of 0.020%), Immigrants from Nigeria (1.8%, a difference of 0.23%), White/Caucasian (1.8%, a difference of 0.29%), Immigrants from South America (1.8%, a difference of 0.40%), and Immigrants from Ghana (1.8%, a difference of 0.69%). Similarly, the demographic groups most similar to Nigerians are Finnish (1.8%, a difference of 0.33%), Slovak (1.8%, a difference of 0.57%), Peruvian (1.8%, a difference of 0.89%), Czechoslovakian (1.8%, a difference of 1.1%), and German (1.8%, a difference of 1.6%).
| Demographics | Rating | Rank | Doctorate Degree |
| Finns | 42.1 /100 | #183 | Average 1.8% |
| Nigerians | 39.9 /100 | #184 | Fair 1.8% |
| Slovaks | 36.4 /100 | #185 | Fair 1.8% |
| Peruvians | 34.4 /100 | #186 | Fair 1.8% |
| Czechoslovakians | 33.0 /100 | #187 | Fair 1.8% |
| Germans | 30.5 /100 | #188 | Fair 1.8% |
| French Canadians | 30.2 /100 | #189 | Fair 1.8% |
| Immigrants | Costa Rica | 30.2 /100 | #190 | Fair 1.8% |
| South Americans | 29.5 /100 | #191 | Fair 1.8% |
| Dutch | 27.4 /100 | #192 | Fair 1.8% |
| German Russians | 27.1 /100 | #193 | Fair 1.8% |
| Uruguayans | 26.2 /100 | #194 | Fair 1.8% |
| Immigrants | Somalia | 25.4 /100 | #195 | Fair 1.8% |
| Sub-Saharan Africans | 25.1 /100 | #196 | Fair 1.8% |
| Chinese | 25.1 /100 | #197 | Fair 1.8% |
| Immigrants | Ghana | 24.6 /100 | #198 | Fair 1.8% |
| Immigrants | South America | 23.3 /100 | #199 | Fair 1.8% |
| Whites/Caucasians | 22.8 /100 | #200 | Fair 1.8% |
| Immigrants | Nigeria | 22.4 /100 | #201 | Fair 1.8% |
| Portuguese | 21.4 /100 | #202 | Fair 1.8% |
| Immigrants | Vietnam | 21.4 /100 | #203 | Fair 1.8% |