Portuguese vs Creek Doctorate Degree
COMPARE
Portuguese
Creek
Doctorate Degree
Doctorate Degree Comparison
Portuguese
Creek
1.8%
DOCTORATE DEGREE
21.4/ 100
METRIC RATING
202nd/ 347
METRIC RANK
1.3%
DOCTORATE DEGREE
0.1/ 100
METRIC RATING
318th/ 347
METRIC RANK
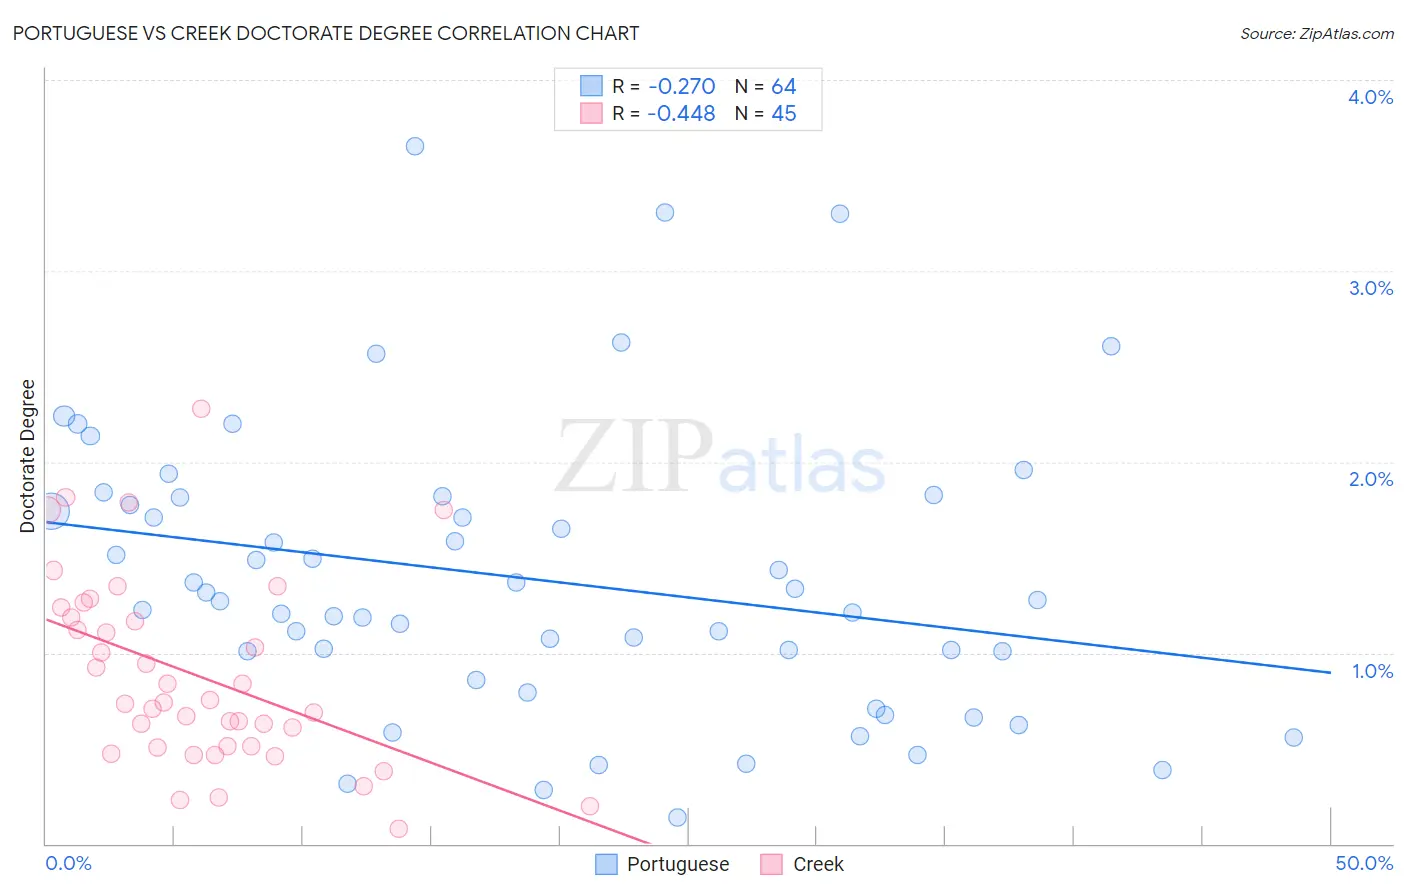
Portuguese vs Creek Doctorate Degree Correlation Chart
The statistical analysis conducted on geographies consisting of 443,772,910 people shows a weak negative correlation between the proportion of Portuguese and percentage of population with at least doctorate degree education in the United States with a correlation coefficient (R) of -0.270 and weighted average of 1.8%. Similarly, the statistical analysis conducted on geographies consisting of 176,594,001 people shows a moderate negative correlation between the proportion of Creek and percentage of population with at least doctorate degree education in the United States with a correlation coefficient (R) of -0.448 and weighted average of 1.3%, a difference of 30.1%.
Doctorate Degree Correlation Summary
| Measurement | Portuguese | Creek |
| Minimum | 0.14% | 0.080% |
| Maximum | 3.7% | 2.3% |
| Range | 3.5% | 2.2% |
| Mean | 1.4% | 0.88% |
| Median | 1.3% | 0.74% |
| Interquartile 25% (IQ1) | 0.93% | 0.50% |
| Interquartile 75% (IQ3) | 1.8% | 1.2% |
| Interquartile Range (IQR) | 0.86% | 0.71% |
| Standard Deviation (Sample) | 0.75% | 0.50% |
| Standard Deviation (Population) | 0.74% | 0.49% |
Similar Demographics by Doctorate Degree
Demographics Similar to Portuguese by Doctorate Degree
In terms of doctorate degree, the demographic groups most similar to Portuguese are Immigrants from Vietnam (1.8%, a difference of 0.020%), Somali (1.7%, a difference of 0.050%), Immigrants from Nigeria (1.8%, a difference of 0.23%), White/Caucasian (1.8%, a difference of 0.29%), and Immigrants from South America (1.8%, a difference of 0.40%).
| Demographics | Rating | Rank | Doctorate Degree |
| Immigrants | Somalia | 25.4 /100 | #195 | Fair 1.8% |
| Sub-Saharan Africans | 25.1 /100 | #196 | Fair 1.8% |
| Chinese | 25.1 /100 | #197 | Fair 1.8% |
| Immigrants | Ghana | 24.6 /100 | #198 | Fair 1.8% |
| Immigrants | South America | 23.3 /100 | #199 | Fair 1.8% |
| Whites/Caucasians | 22.8 /100 | #200 | Fair 1.8% |
| Immigrants | Nigeria | 22.4 /100 | #201 | Fair 1.8% |
| Portuguese | 21.4 /100 | #202 | Fair 1.8% |
| Immigrants | Vietnam | 21.4 /100 | #203 | Fair 1.8% |
| Somalis | 21.2 /100 | #204 | Fair 1.7% |
| Venezuelans | 19.5 /100 | #205 | Poor 1.7% |
| Immigrants | Peru | 17.6 /100 | #206 | Poor 1.7% |
| Yugoslavians | 17.1 /100 | #207 | Poor 1.7% |
| Colombians | 16.1 /100 | #208 | Poor 1.7% |
| Immigrants | Western Africa | 15.4 /100 | #209 | Poor 1.7% |
Demographics Similar to Creek by Doctorate Degree
In terms of doctorate degree, the demographic groups most similar to Creek are Immigrants from Micronesia (1.3%, a difference of 0.050%), Navajo (1.4%, a difference of 0.30%), Immigrants from the Azores (1.4%, a difference of 0.51%), Dominican (1.4%, a difference of 0.53%), and Menominee (1.4%, a difference of 0.61%).
| Demographics | Rating | Rank | Doctorate Degree |
| Immigrants | Honduras | 0.1 /100 | #311 | Tragic 1.4% |
| Immigrants | Nicaragua | 0.1 /100 | #312 | Tragic 1.4% |
| Menominee | 0.1 /100 | #313 | Tragic 1.4% |
| Dominicans | 0.1 /100 | #314 | Tragic 1.4% |
| Immigrants | Azores | 0.1 /100 | #315 | Tragic 1.4% |
| Navajo | 0.1 /100 | #316 | Tragic 1.4% |
| Immigrants | Micronesia | 0.1 /100 | #317 | Tragic 1.3% |
| Creek | 0.1 /100 | #318 | Tragic 1.3% |
| Immigrants | Guyana | 0.1 /100 | #319 | Tragic 1.3% |
| Immigrants | St. Vincent and the Grenadines | 0.1 /100 | #320 | Tragic 1.3% |
| Dutch West Indians | 0.1 /100 | #321 | Tragic 1.3% |
| Seminole | 0.1 /100 | #322 | Tragic 1.3% |
| Immigrants | Belize | 0.1 /100 | #323 | Tragic 1.3% |
| Natives/Alaskans | 0.0 /100 | #324 | Tragic 1.3% |
| Pima | 0.0 /100 | #325 | Tragic 1.3% |