Polish vs Italian No Schooling Completed
COMPARE
Polish
Italian
No Schooling Completed
No Schooling Completed Comparison
Poles
Italians
1.4%
NO SCHOOLING COMPLETED
100.0/ 100
METRIC RATING
13th/ 347
METRIC RANK
1.5%
NO SCHOOLING COMPLETED
100.0/ 100
METRIC RATING
33rd/ 347
METRIC RANK
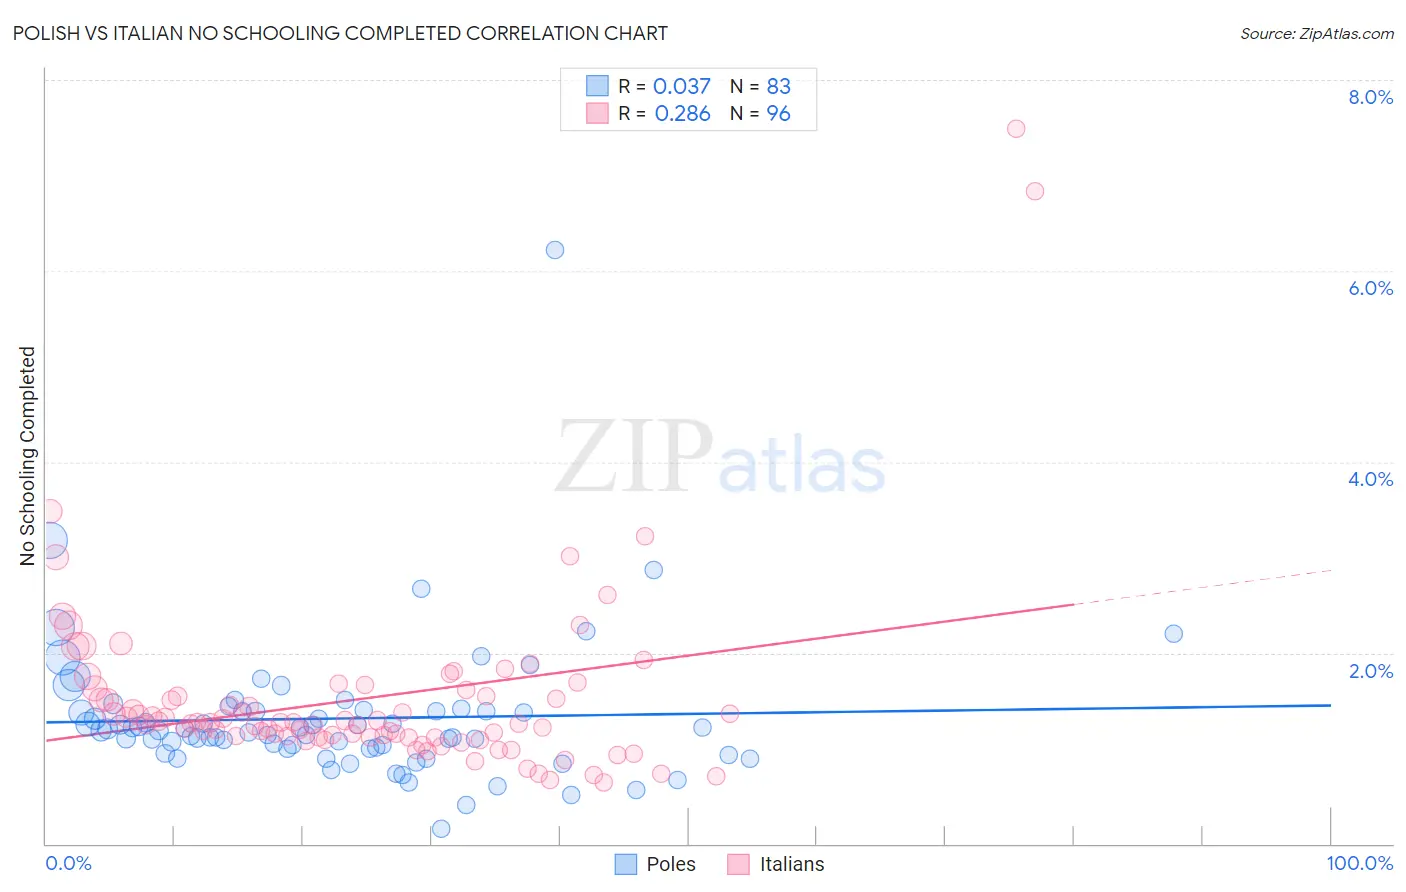
Polish vs Italian No Schooling Completed Correlation Chart
The statistical analysis conducted on geographies consisting of 543,036,846 people shows no correlation between the proportion of Poles and percentage of population with no schooling in the United States with a correlation coefficient (R) of 0.037 and weighted average of 1.4%. Similarly, the statistical analysis conducted on geographies consisting of 555,839,647 people shows a weak positive correlation between the proportion of Italians and percentage of population with no schooling in the United States with a correlation coefficient (R) of 0.286 and weighted average of 1.5%, a difference of 7.0%.
No Schooling Completed Correlation Summary
| Measurement | Polish | Italian |
| Minimum | 0.16% | 0.64% |
| Maximum | 6.2% | 7.5% |
| Range | 6.1% | 6.8% |
| Mean | 1.3% | 1.5% |
| Median | 1.2% | 1.3% |
| Interquartile 25% (IQ1) | 1.00% | 1.1% |
| Interquartile 75% (IQ3) | 1.4% | 1.6% |
| Interquartile Range (IQR) | 0.39% | 0.47% |
| Standard Deviation (Sample) | 0.74% | 0.98% |
| Standard Deviation (Population) | 0.74% | 0.98% |
Demographics Similar to Poles and Italians by No Schooling Completed
In terms of no schooling completed, the demographic groups most similar to Poles are Scotch-Irish (1.5%, a difference of 0.94%), Tlingit-Haida (1.5%, a difference of 1.0%), Finnish (1.5%, a difference of 1.5%), Croatian (1.5%, a difference of 1.5%), and Danish (1.5%, a difference of 1.8%). Similarly, the demographic groups most similar to Italians are Swiss (1.5%, a difference of 0.68%), Inupiat (1.5%, a difference of 1.1%), British (1.5%, a difference of 1.1%), Lumbee (1.5%, a difference of 1.6%), and French Canadian (1.5%, a difference of 2.5%).
| Demographics | Rating | Rank | No Schooling Completed |
| Poles | 100.0 /100 | #13 | Exceptional 1.4% |
| Scotch-Irish | 100.0 /100 | #14 | Exceptional 1.5% |
| Tlingit-Haida | 100.0 /100 | #15 | Exceptional 1.5% |
| Finns | 100.0 /100 | #16 | Exceptional 1.5% |
| Croatians | 100.0 /100 | #17 | Exceptional 1.5% |
| Danes | 100.0 /100 | #18 | Exceptional 1.5% |
| Alaskan Athabascans | 100.0 /100 | #19 | Exceptional 1.5% |
| Welsh | 100.0 /100 | #20 | Exceptional 1.5% |
| Chinese | 100.0 /100 | #21 | Exceptional 1.5% |
| Alaska Natives | 100.0 /100 | #22 | Exceptional 1.5% |
| Europeans | 100.0 /100 | #23 | Exceptional 1.5% |
| Pennsylvania Germans | 100.0 /100 | #24 | Exceptional 1.5% |
| French | 100.0 /100 | #25 | Exceptional 1.5% |
| Czechs | 100.0 /100 | #26 | Exceptional 1.5% |
| Scandinavians | 100.0 /100 | #27 | Exceptional 1.5% |
| French Canadians | 100.0 /100 | #28 | Exceptional 1.5% |
| Lumbee | 100.0 /100 | #29 | Exceptional 1.5% |
| British | 100.0 /100 | #30 | Exceptional 1.5% |
| Inupiat | 100.0 /100 | #31 | Exceptional 1.5% |
| Swiss | 100.0 /100 | #32 | Exceptional 1.5% |
| Italians | 100.0 /100 | #33 | Exceptional 1.5% |