Polish vs Norwegian No Schooling Completed
COMPARE
Polish
Norwegian
No Schooling Completed
No Schooling Completed Comparison
Poles
Norwegians
1.4%
NO SCHOOLING COMPLETED
100.0/ 100
METRIC RATING
13th/ 347
METRIC RANK
1.3%
NO SCHOOLING COMPLETED
100.0/ 100
METRIC RATING
3rd/ 347
METRIC RANK
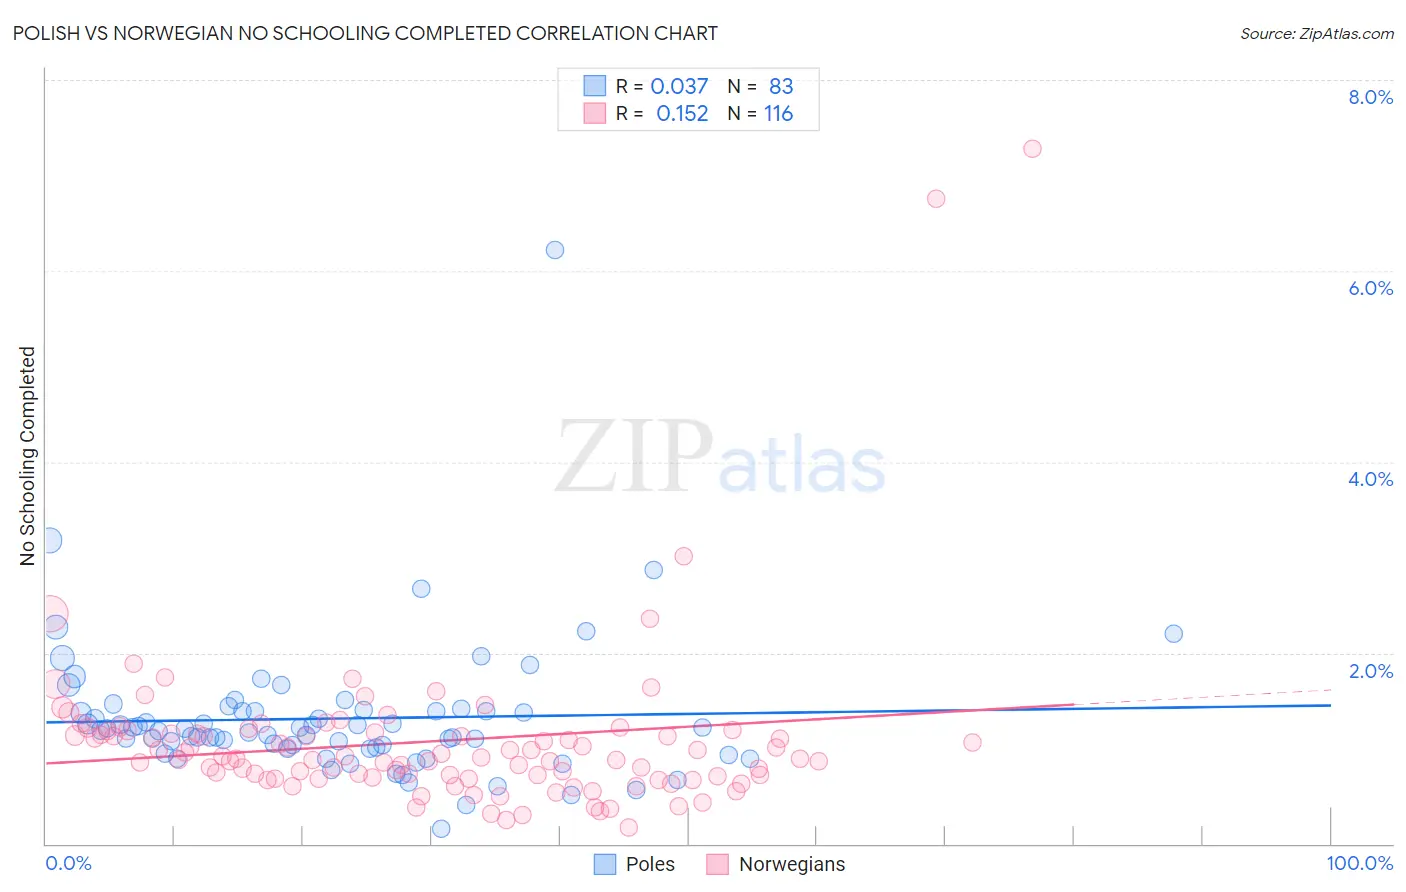
Polish vs Norwegian No Schooling Completed Correlation Chart
The statistical analysis conducted on geographies consisting of 543,036,846 people shows no correlation between the proportion of Poles and percentage of population with no schooling in the United States with a correlation coefficient (R) of 0.037 and weighted average of 1.4%. Similarly, the statistical analysis conducted on geographies consisting of 518,592,582 people shows a poor positive correlation between the proportion of Norwegians and percentage of population with no schooling in the United States with a correlation coefficient (R) of 0.152 and weighted average of 1.3%, a difference of 6.6%.
No Schooling Completed Correlation Summary
| Measurement | Polish | Norwegian |
| Minimum | 0.16% | 0.17% |
| Maximum | 6.2% | 7.3% |
| Range | 6.1% | 7.1% |
| Mean | 1.3% | 1.1% |
| Median | 1.2% | 0.89% |
| Interquartile 25% (IQ1) | 1.00% | 0.70% |
| Interquartile 75% (IQ3) | 1.4% | 1.2% |
| Interquartile Range (IQR) | 0.39% | 0.46% |
| Standard Deviation (Sample) | 0.74% | 0.90% |
| Standard Deviation (Population) | 0.74% | 0.90% |
Demographics Similar to Poles and Norwegians by No Schooling Completed
In terms of no schooling completed, the demographic groups most similar to Poles are Irish (1.4%, a difference of 0.030%), Lithuanian (1.4%, a difference of 0.050%), Dutch (1.4%, a difference of 0.89%), Scotch-Irish (1.5%, a difference of 0.94%), and Tlingit-Haida (1.5%, a difference of 1.0%). Similarly, the demographic groups most similar to Norwegians are Slovak (1.3%, a difference of 0.43%), German (1.4%, a difference of 0.56%), Slovene (1.4%, a difference of 0.98%), Carpatho Rusyn (1.4%, a difference of 1.8%), and English (1.4%, a difference of 2.8%).
| Demographics | Rating | Rank | No Schooling Completed |
| Yup'ik | 100.0 /100 | #1 | Exceptional 1.2% |
| Slovaks | 100.0 /100 | #2 | Exceptional 1.3% |
| Norwegians | 100.0 /100 | #3 | Exceptional 1.3% |
| Germans | 100.0 /100 | #4 | Exceptional 1.4% |
| Slovenes | 100.0 /100 | #5 | Exceptional 1.4% |
| Carpatho Rusyns | 100.0 /100 | #6 | Exceptional 1.4% |
| English | 100.0 /100 | #7 | Exceptional 1.4% |
| Swedes | 100.0 /100 | #8 | Exceptional 1.4% |
| Scottish | 100.0 /100 | #9 | Exceptional 1.4% |
| Dutch | 100.0 /100 | #10 | Exceptional 1.4% |
| Lithuanians | 100.0 /100 | #11 | Exceptional 1.4% |
| Irish | 100.0 /100 | #12 | Exceptional 1.4% |
| Poles | 100.0 /100 | #13 | Exceptional 1.4% |
| Scotch-Irish | 100.0 /100 | #14 | Exceptional 1.5% |
| Tlingit-Haida | 100.0 /100 | #15 | Exceptional 1.5% |
| Finns | 100.0 /100 | #16 | Exceptional 1.5% |
| Croatians | 100.0 /100 | #17 | Exceptional 1.5% |
| Danes | 100.0 /100 | #18 | Exceptional 1.5% |
| Alaskan Athabascans | 100.0 /100 | #19 | Exceptional 1.5% |
| Welsh | 100.0 /100 | #20 | Exceptional 1.5% |