Immigrants from Uganda vs Italian No Schooling Completed
COMPARE
Immigrants from Uganda
Italian
No Schooling Completed
No Schooling Completed Comparison
Immigrants from Uganda
Italians
2.3%
NO SCHOOLING COMPLETED
4.0/ 100
METRIC RATING
227th/ 347
METRIC RANK
1.5%
NO SCHOOLING COMPLETED
100.0/ 100
METRIC RATING
33rd/ 347
METRIC RANK
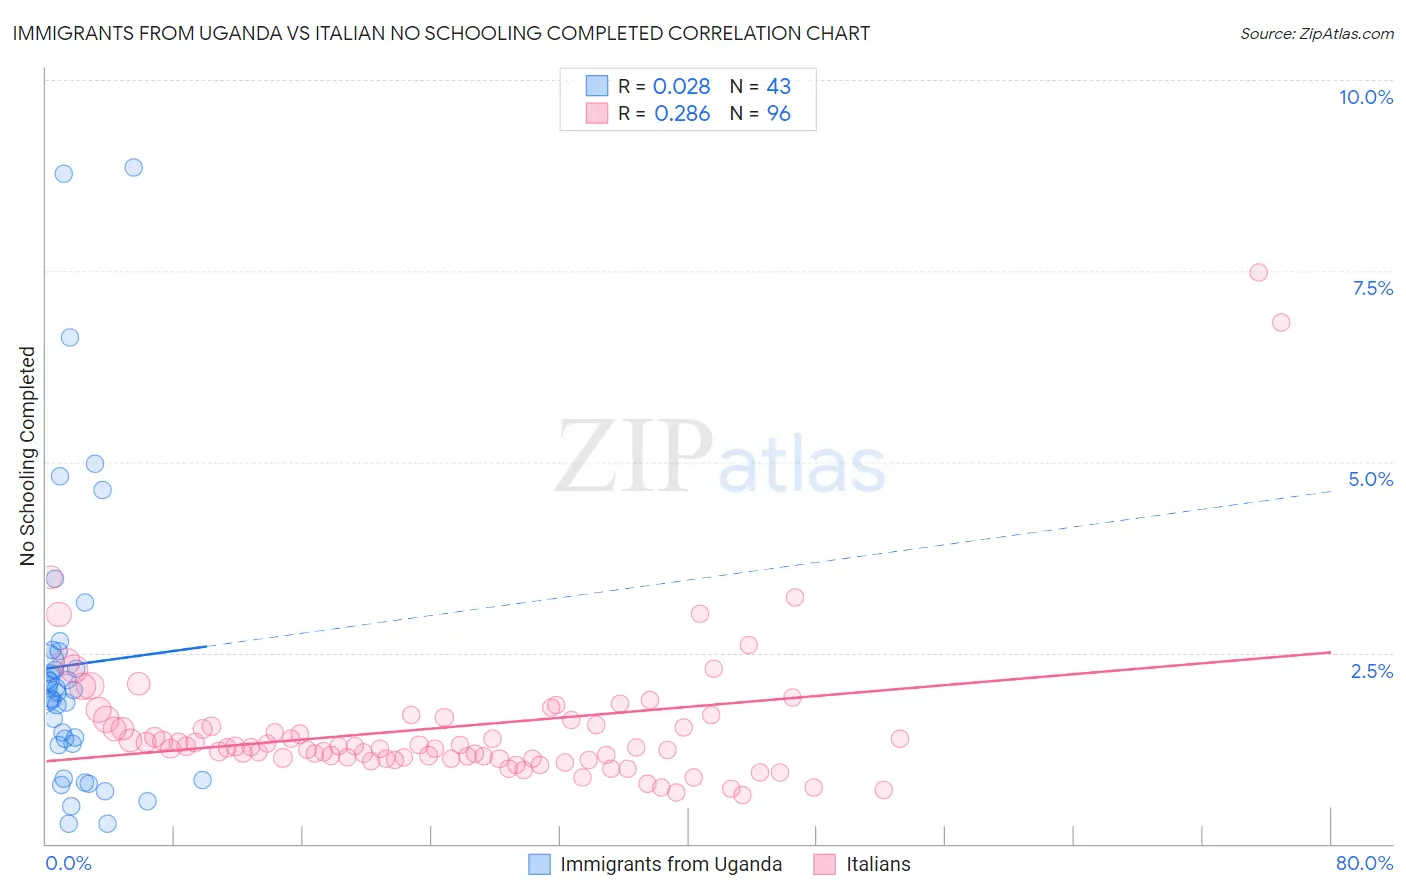
Immigrants from Uganda vs Italian No Schooling Completed Correlation Chart
The statistical analysis conducted on geographies consisting of 125,578,138 people shows no correlation between the proportion of Immigrants from Uganda and percentage of population with no schooling in the United States with a correlation coefficient (R) of 0.028 and weighted average of 2.3%. Similarly, the statistical analysis conducted on geographies consisting of 555,839,647 people shows a weak positive correlation between the proportion of Italians and percentage of population with no schooling in the United States with a correlation coefficient (R) of 0.286 and weighted average of 1.5%, a difference of 50.4%.
No Schooling Completed Correlation Summary
| Measurement | Immigrants from Uganda | Italian |
| Minimum | 0.25% | 0.64% |
| Maximum | 8.8% | 7.5% |
| Range | 8.6% | 6.8% |
| Mean | 2.3% | 1.5% |
| Median | 2.0% | 1.3% |
| Interquartile 25% (IQ1) | 1.3% | 1.1% |
| Interquartile 75% (IQ3) | 2.5% | 1.6% |
| Interquartile Range (IQR) | 1.2% | 0.47% |
| Standard Deviation (Sample) | 1.9% | 0.98% |
| Standard Deviation (Population) | 1.9% | 0.98% |
Similar Demographics by No Schooling Completed
Demographics Similar to Immigrants from Uganda by No Schooling Completed
In terms of no schooling completed, the demographic groups most similar to Immigrants from Uganda are Sierra Leonean (2.3%, a difference of 0.060%), Tohono O'odham (2.3%, a difference of 0.070%), Sudanese (2.3%, a difference of 0.070%), U.S. Virgin Islander (2.3%, a difference of 0.29%), and Immigrants from Lebanon (2.3%, a difference of 0.36%).
| Demographics | Rating | Rank | No Schooling Completed |
| Immigrants | Costa Rica | 5.1 /100 | #220 | Tragic 2.3% |
| Immigrants | Sudan | 5.0 /100 | #221 | Tragic 2.3% |
| Sub-Saharan Africans | 4.7 /100 | #222 | Tragic 2.3% |
| Immigrants | Lebanon | 4.5 /100 | #223 | Tragic 2.3% |
| Tohono O'odham | 4.1 /100 | #224 | Tragic 2.3% |
| Sudanese | 4.1 /100 | #225 | Tragic 2.3% |
| Sierra Leoneans | 4.1 /100 | #226 | Tragic 2.3% |
| Immigrants | Uganda | 4.0 /100 | #227 | Tragic 2.3% |
| U.S. Virgin Islanders | 3.7 /100 | #228 | Tragic 2.3% |
| Immigrants | Pakistan | 3.6 /100 | #229 | Tragic 2.3% |
| Puerto Ricans | 3.4 /100 | #230 | Tragic 2.3% |
| Immigrants | Uruguay | 3.4 /100 | #231 | Tragic 2.3% |
| Colombians | 3.2 /100 | #232 | Tragic 2.3% |
| Immigrants | Malaysia | 2.8 /100 | #233 | Tragic 2.3% |
| Nigerians | 2.6 /100 | #234 | Tragic 2.3% |
Demographics Similar to Italians by No Schooling Completed
In terms of no schooling completed, the demographic groups most similar to Italians are Latvian (1.5%, a difference of 0.25%), Swiss (1.5%, a difference of 0.68%), Inupiat (1.5%, a difference of 1.1%), British (1.5%, a difference of 1.1%), and Eastern European (1.6%, a difference of 1.2%).
| Demographics | Rating | Rank | No Schooling Completed |
| Czechs | 100.0 /100 | #26 | Exceptional 1.5% |
| Scandinavians | 100.0 /100 | #27 | Exceptional 1.5% |
| French Canadians | 100.0 /100 | #28 | Exceptional 1.5% |
| Lumbee | 100.0 /100 | #29 | Exceptional 1.5% |
| British | 100.0 /100 | #30 | Exceptional 1.5% |
| Inupiat | 100.0 /100 | #31 | Exceptional 1.5% |
| Swiss | 100.0 /100 | #32 | Exceptional 1.5% |
| Italians | 100.0 /100 | #33 | Exceptional 1.5% |
| Latvians | 100.0 /100 | #34 | Exceptional 1.5% |
| Eastern Europeans | 100.0 /100 | #35 | Exceptional 1.6% |
| Aleuts | 99.9 /100 | #36 | Exceptional 1.6% |
| Belgians | 99.9 /100 | #37 | Exceptional 1.6% |
| Northern Europeans | 99.9 /100 | #38 | Exceptional 1.6% |
| Native Hawaiians | 99.9 /100 | #39 | Exceptional 1.6% |
| Luxembourgers | 99.9 /100 | #40 | Exceptional 1.6% |