Celtic vs Immigrants from West Indies 8th Grade
COMPARE
Celtic
Immigrants from West Indies
8th Grade
8th Grade Comparison
Celtics
Immigrants from West Indies
96.8%
8TH GRADE
99.9/ 100
METRIC RATING
51st/ 347
METRIC RANK
94.3%
8TH GRADE
0.0/ 100
METRIC RATING
290th/ 347
METRIC RANK
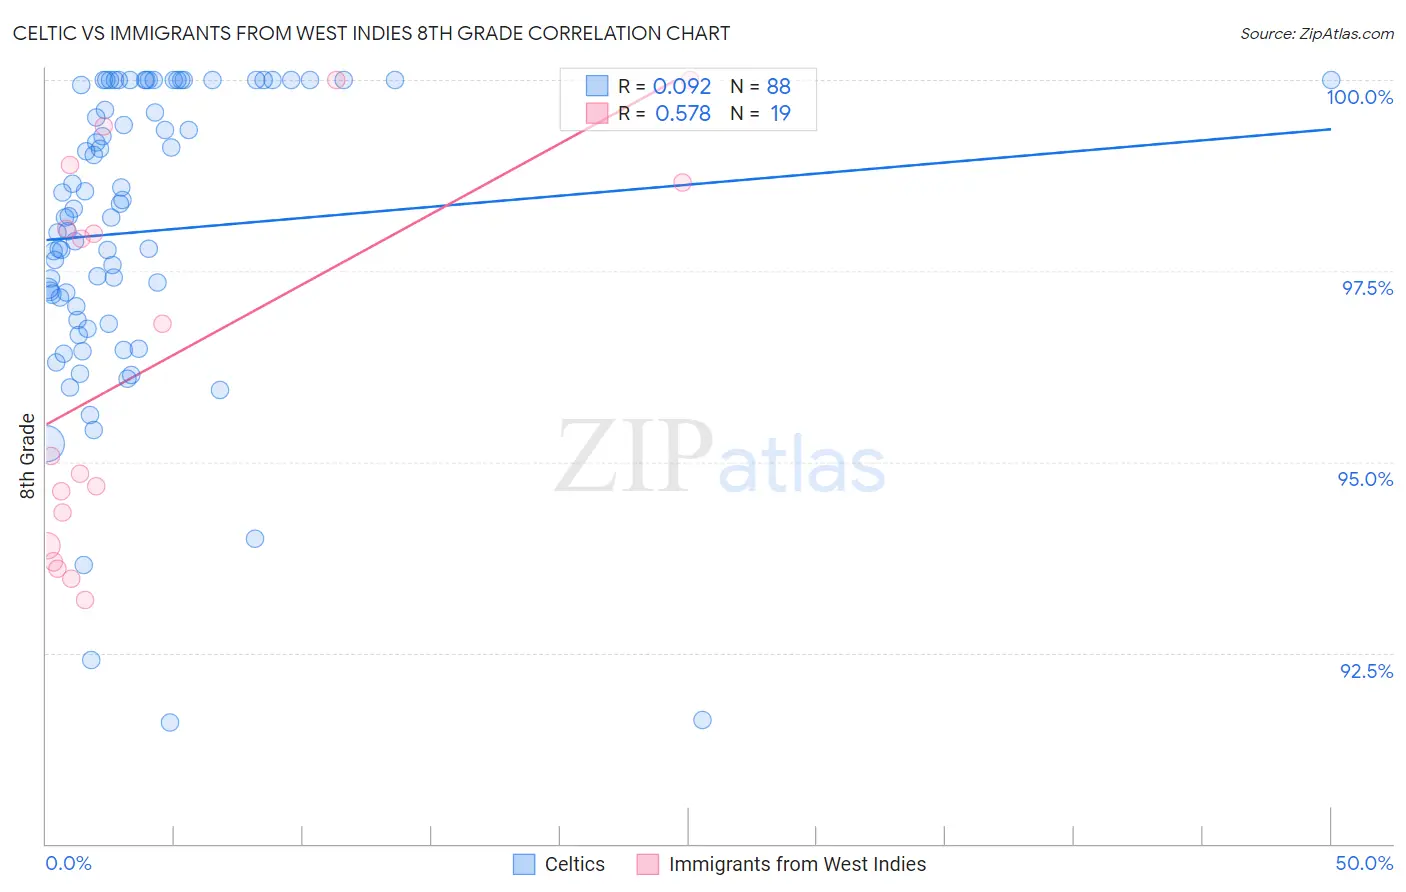
Celtic vs Immigrants from West Indies 8th Grade Correlation Chart
The statistical analysis conducted on geographies consisting of 168,876,981 people shows a slight positive correlation between the proportion of Celtics and percentage of population with at least 8th grade education in the United States with a correlation coefficient (R) of 0.092 and weighted average of 96.8%. Similarly, the statistical analysis conducted on geographies consisting of 72,457,514 people shows a substantial positive correlation between the proportion of Immigrants from West Indies and percentage of population with at least 8th grade education in the United States with a correlation coefficient (R) of 0.578 and weighted average of 94.3%, a difference of 2.6%.
8th Grade Correlation Summary
| Measurement | Celtic | Immigrants from West Indies |
| Minimum | 91.6% | 93.2% |
| Maximum | 100.0% | 100.0% |
| Range | 8.4% | 6.8% |
| Mean | 98.0% | 96.3% |
| Median | 98.2% | 95.1% |
| Interquartile 25% (IQ1) | 96.9% | 93.9% |
| Interquartile 75% (IQ3) | 100.0% | 98.7% |
| Interquartile Range (IQR) | 3.1% | 4.8% |
| Standard Deviation (Sample) | 1.9% | 2.5% |
| Standard Deviation (Population) | 1.9% | 2.4% |
Similar Demographics by 8th Grade
Demographics Similar to Celtics by 8th Grade
In terms of 8th grade, the demographic groups most similar to Celtics are Immigrants from Scotland (96.8%, a difference of 0.010%), Estonian (96.8%, a difference of 0.020%), Slavic (96.8%, a difference of 0.030%), Greek (96.8%, a difference of 0.030%), and Austrian (96.7%, a difference of 0.050%).
| Demographics | Rating | Rank | 8th Grade |
| Maltese | 99.9 /100 | #44 | Exceptional 96.9% |
| Northern Europeans | 99.9 /100 | #45 | Exceptional 96.9% |
| Czechoslovakians | 99.9 /100 | #46 | Exceptional 96.9% |
| Bulgarians | 99.9 /100 | #47 | Exceptional 96.9% |
| Slavs | 99.9 /100 | #48 | Exceptional 96.8% |
| Estonians | 99.9 /100 | #49 | Exceptional 96.8% |
| Immigrants | Scotland | 99.9 /100 | #50 | Exceptional 96.8% |
| Celtics | 99.9 /100 | #51 | Exceptional 96.8% |
| Greeks | 99.9 /100 | #52 | Exceptional 96.8% |
| Austrians | 99.9 /100 | #53 | Exceptional 96.7% |
| Serbians | 99.8 /100 | #54 | Exceptional 96.7% |
| Russians | 99.8 /100 | #55 | Exceptional 96.7% |
| Australians | 99.8 /100 | #56 | Exceptional 96.7% |
| Macedonians | 99.8 /100 | #57 | Exceptional 96.7% |
| Immigrants | Canada | 99.8 /100 | #58 | Exceptional 96.7% |
Demographics Similar to Immigrants from West Indies by 8th Grade
In terms of 8th grade, the demographic groups most similar to Immigrants from West Indies are Immigrants from Grenada (94.3%, a difference of 0.010%), British West Indian (94.4%, a difference of 0.070%), Bangladeshi (94.3%, a difference of 0.080%), Yaqui (94.2%, a difference of 0.11%), and Houma (94.2%, a difference of 0.12%).
| Demographics | Rating | Rank | 8th Grade |
| Immigrants | St. Vincent and the Grenadines | 0.1 /100 | #283 | Tragic 94.6% |
| Immigrants | Philippines | 0.1 /100 | #284 | Tragic 94.6% |
| Immigrants | Barbados | 0.0 /100 | #285 | Tragic 94.5% |
| Immigrants | Peru | 0.0 /100 | #286 | Tragic 94.5% |
| Tohono O'odham | 0.0 /100 | #287 | Tragic 94.5% |
| Malaysians | 0.0 /100 | #288 | Tragic 94.5% |
| British West Indians | 0.0 /100 | #289 | Tragic 94.4% |
| Immigrants | West Indies | 0.0 /100 | #290 | Tragic 94.3% |
| Immigrants | Grenada | 0.0 /100 | #291 | Tragic 94.3% |
| Bangladeshis | 0.0 /100 | #292 | Tragic 94.3% |
| Yaqui | 0.0 /100 | #293 | Tragic 94.2% |
| Houma | 0.0 /100 | #294 | Tragic 94.2% |
| Fijians | 0.0 /100 | #295 | Tragic 94.2% |
| Haitians | 0.0 /100 | #296 | Tragic 94.2% |
| Immigrants | South Eastern Asia | 0.0 /100 | #297 | Tragic 94.2% |