Immigrants from Spain vs Bahamian 11th Grade

COMPARE

Immigrants from Spain
Race
Ancestry
AfghanAfricanAlaska NativeAlaskan AthabascanAlbanianAleutAlsatianAmericanApacheArabArapahoArgentineanArmenianAssyrian/Chaldean/SyriacAustralianAustrianBangladeshiBarbadianBasqueBelgianBelizeanBermudanBhutaneseBlackfeetBolivianBrazilianBritishBritish West IndianBulgarianBurmeseCajunCambodianCanadianCape VerdeanCarpatho RusynCelticCentral AmericanCentral American IndianCherokeeCheyenneChickasawChileanChineseChippewaChoctawColombianColvilleComancheCosta RicanCreeCreekCroatianCrowCubanCypriotCzechCzechoslovakianDanishDelawareDominicanDutchDutch West IndianEastern EuropeanEcuadorianEgyptianEnglishEstonianEthiopianEuropeanFijianFilipinoFinnishFrenchFrench American IndianFrench CanadianGermanGerman RussianGhanaianGreekGuamanian/ChamorroGuatemalanGuyaneseHaitianHmongHonduranHopiHoumaHungarianIcelanderIndian (Asian)IndonesianInupiatIranianIraqiIrishIroquoisIsraeliItalianJamaicanJapaneseJordanianKenyanKiowaKoreanLaotianLatvianLebaneseLiberianLithuanianLumbeeLuxembourgerMacedonianMalaysianMalteseMarshalleseMenomineeMexicanMexican American IndianMongolianMoroccanNative HawaiianNavajoNepaleseNew ZealanderNicaraguanNigerianNorthern EuropeanNorwegianOkinawanOsageOttawaPaiutePakistaniPalestinianPanamanianParaguayanPennsylvania GermanPeruvianPimaPolishPortuguesePotawatomiPuebloPuerto RicanPuget Sound SalishRomanianRussianSalvadoranSamoanScandinavianScotch-IrishScottishSeminoleSenegaleseSerbianShoshoneSierra LeoneanSiouxSlavicSlovakSloveneSomaliSouth AfricanSouth AmericanSouth American IndianSoviet UnionSpaniardSpanishSpanish AmericanSpanish American IndianSri LankanSubsaharan AfricanSudaneseSwedishSwissSyrianTaiwaneseThaiTlingit-HaidaTohono O'OdhamTonganTrinidadian and TobagonianTsimshianTurkishU.S. Virgin IslanderUgandanUkrainianUruguayanUteVenezuelanVietnameseWelshWest IndianYakamaYaquiYugoslavianYumanYup'ikZimbabwean
Immigration
NonimmigrantsImmigrantsAfghanistanAfricaAlbaniaArgentinaArmeniaAsiaAustraliaAustriaBahamasBangladeshBarbadosBelarusBelgiumBelizeBoliviaBosnia and HerzegovinaBrazilBulgariaBurma/MyanmarCabo VerdeCambodiaCameroonCanadaCaribbeanCentral AmericaChileChinaColombiaCongoCosta RicaCroatiaCubaCzechoslovakiaDenmarkDominicaDominican RepublicEastern AfricaEastern AsiaEastern EuropeEcuadorEgyptEl SalvadorEnglandEritreaEthiopiaEuropeFijiFranceGermanyGhanaGreeceGrenadaGuatemalaGuyanaHaitiHondurasHong KongHungaryIndiaIndonesiaIranIraqIrelandIsraelItalyJamaicaJapanJordanKazakhstanKenyaKoreaKuwaitLaosLatin AmericaLatviaLebanonLiberiaLithuaniaMalaysiaMexicoMicronesiaMiddle AfricaMoldovaMoroccoNepalNetherlandsNicaraguaNigeriaNorth AmericaNorth MacedoniaNorthern AfricaNorthern EuropeNorwayOceaniaPakistanPanamaPeruPhilippinesPolandPortugalRomaniaRussiaSaudi ArabiaScotlandSenegalSerbiaSierra LeoneSingaporeSomaliaSouth AfricaSouth AmericaSouth Central AsiaSouth Eastern AsiaSouthern EuropeSpainSri LankaSt. Vincent and the GrenadinesSudanSwedenSwitzerlandSyriaTaiwanThailandTrinidad and TobagoTurkeyUgandaUkraineUruguayUzbekistanVenezuelaVietnamWest IndiesWestern AfricaWestern AsiaWestern EuropeYemenZaireZimbabweAzores
Bahamian
Race
Ancestry
AfghanAfricanAlaska NativeAlaskan AthabascanAlbanianAleutAlsatianAmericanApacheArabArapahoArgentineanArmenianAssyrian/Chaldean/SyriacAustralianAustrianBahamianBangladeshiBarbadianBasqueBelgianBelizeanBermudanBhutaneseBlackfeetBolivianBrazilianBritishBritish West IndianBulgarianBurmeseCajunCambodianCanadianCape VerdeanCarpatho RusynCelticCentral AmericanCentral American IndianCherokeeCheyenneChickasawChileanChineseChippewaChoctawColombianColvilleComancheCosta RicanCreeCreekCroatianCrowCubanCypriotCzechCzechoslovakianDanishDelawareDominicanDutchDutch West IndianEastern EuropeanEcuadorianEgyptianEnglishEstonianEthiopianEuropeanFijianFilipinoFinnishFrenchFrench American IndianFrench CanadianGermanGerman RussianGhanaianGreekGuamanian/ChamorroGuatemalanGuyaneseHaitianHmongHonduranHopiHoumaHungarianIcelanderIndian (Asian)IndonesianInupiatIranianIraqiIrishIroquoisIsraeliItalianJamaicanJapaneseJordanianKenyanKiowaKoreanLaotianLatvianLebaneseLiberianLithuanianLumbeeLuxembourgerMacedonianMalaysianMalteseMarshalleseMenomineeMexicanMexican American IndianMongolianMoroccanNative HawaiianNavajoNepaleseNew ZealanderNicaraguanNigerianNorthern EuropeanNorwegianOkinawanOsageOttawaPaiutePakistaniPalestinianPanamanianParaguayanPennsylvania GermanPeruvianPimaPolishPortuguesePotawatomiPuebloPuerto RicanPuget Sound SalishRomanianRussianSalvadoranSamoanScandinavianScotch-IrishScottishSeminoleSenegaleseSerbianShoshoneSierra LeoneanSiouxSlavicSlovakSloveneSomaliSouth AfricanSouth AmericanSouth American IndianSoviet UnionSpaniardSpanishSpanish AmericanSpanish American IndianSri LankanSubsaharan AfricanSudaneseSwedishSwissSyrianTaiwaneseThaiTlingit-HaidaTohono O'OdhamTonganTrinidadian and TobagonianTsimshianTurkishU.S. Virgin IslanderUgandanUkrainianUruguayanUteVenezuelanVietnameseWelshWest IndianYakamaYaquiYugoslavianYumanYup'ikZimbabwean
Immigration
NonimmigrantsImmigrantsAfghanistanAfricaAlbaniaArgentinaArmeniaAsiaAustraliaAustriaBahamasBangladeshBarbadosBelarusBelgiumBelizeBoliviaBosnia and HerzegovinaBrazilBulgariaBurma/MyanmarCabo VerdeCambodiaCameroonCanadaCaribbeanCentral AmericaChileChinaColombiaCongoCosta RicaCroatiaCubaCzechoslovakiaDenmarkDominicaDominican RepublicEastern AfricaEastern AsiaEastern EuropeEcuadorEgyptEl SalvadorEnglandEritreaEthiopiaEuropeFijiFranceGermanyGhanaGreeceGrenadaGuatemalaGuyanaHaitiHondurasHong KongHungaryIndiaIndonesiaIranIraqIrelandIsraelItalyJamaicaJapanJordanKazakhstanKenyaKoreaKuwaitLaosLatin AmericaLatviaLebanonLiberiaLithuaniaMalaysiaMexicoMicronesiaMiddle AfricaMoldovaMoroccoNepalNetherlandsNicaraguaNigeriaNorth AmericaNorth MacedoniaNorthern AfricaNorthern EuropeNorwayOceaniaPakistanPanamaPeruPhilippinesPolandPortugalRomaniaRussiaSaudi ArabiaScotlandSenegalSerbiaSierra LeoneSingaporeSomaliaSouth AfricaSouth AmericaSouth Central AsiaSouth Eastern AsiaSouthern EuropeSri LankaSt. Vincent and the GrenadinesSudanSwedenSwitzerlandSyriaTaiwanThailandTrinidad and TobagoTurkeyUgandaUkraineUruguayUzbekistanVenezuelaVietnamWest IndiesWestern AfricaWestern AsiaWestern EuropeYemenZaireZimbabweAzores
11th Grade
Income
Poverty
Unemployment
Labor Participation
Family Structure
Vehicle Availability
Education Level
Disability

11th Grade Comparison

Immigrants from Spain

Bahamians

Good
Tragic
92.7%
11TH GRADE
73.0/ 100
METRIC RATING
156th/ 347
METRIC RANK
91.6%
11TH GRADE
1.8/ 100
METRIC RATING
241st/ 347
METRIC RANK

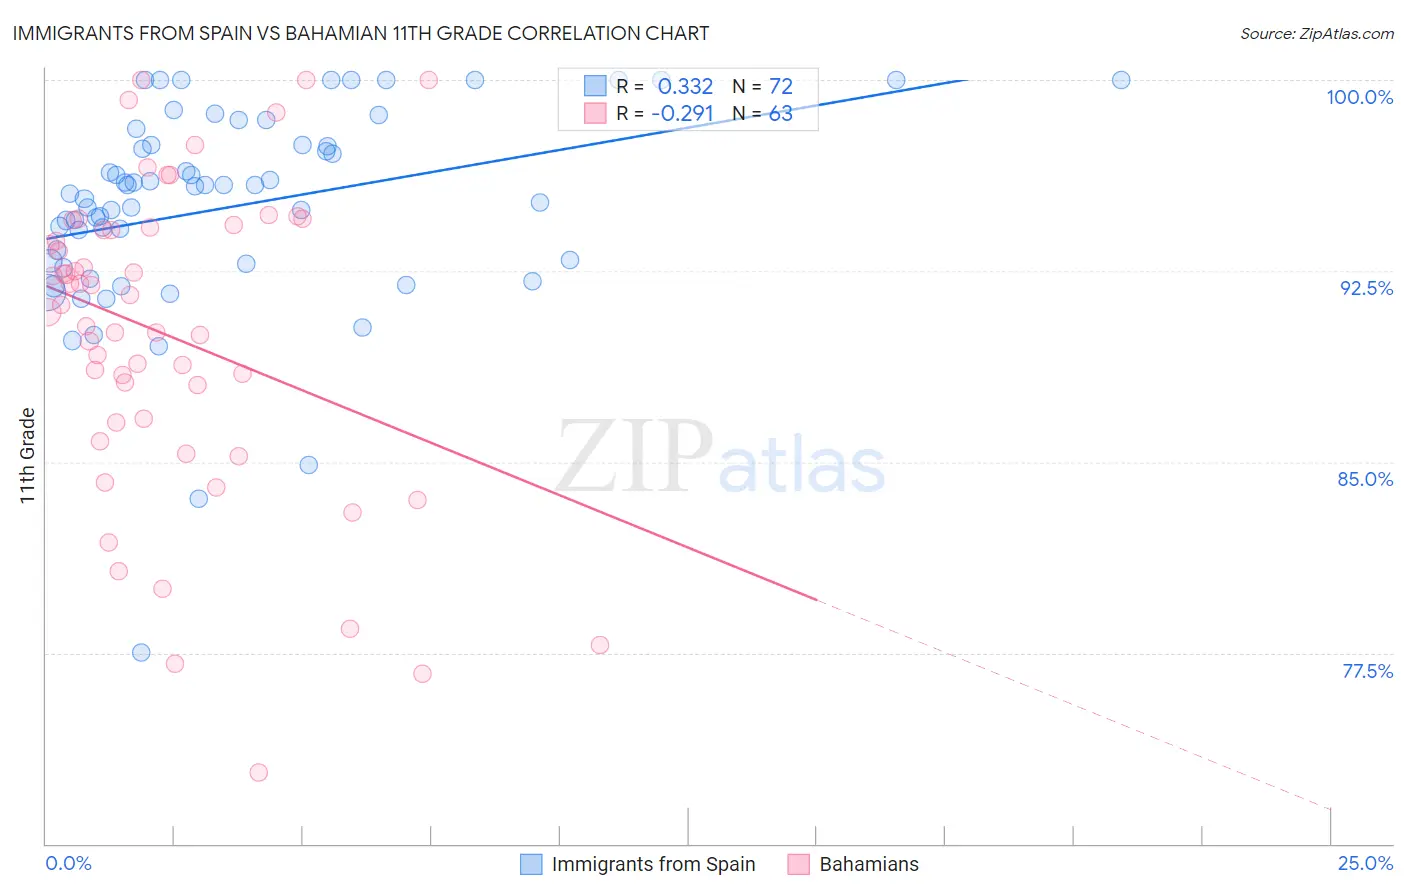
Immigrants from Spain vs Bahamian 11th Grade Correlation Chart

The statistical analysis conducted on geographies consisting of 239,682,725 people shows a mild positive correlation between the proportion of Immigrants from Spain and percentage of population with at least 11th grade education in the United States with a correlation coefficient (R) of 0.332 and weighted average of 92.7%. Similarly, the statistical analysis conducted on geographies consisting of 112,698,819 people shows a weak negative correlation between the proportion of Bahamians and percentage of population with at least 11th grade education in the United States with a correlation coefficient (R) of -0.291 and weighted average of 91.6%, a difference of 1.2%.
Immigrants from Spain vs Bahamian 11th Grade

11th Grade Correlation Summary

MeasurementImmigrants from SpainBahamian
Minimum77.5%72.8%
Maximum100.0%100.0%
Range22.5%27.2%
Mean95.0%90.0%
Median95.7%91.2%
Interquartile 25% (IQ1)92.8%86.5%
Interquartile 75% (IQ3)97.4%94.2%
Interquartile Range (IQR)4.6%7.7%
Standard Deviation (Sample)4.0%6.1%
Standard Deviation (Population)4.0%6.1%

Similar Demographics by 11th Grade

Demographics Similar to Immigrants from Spain by 11th Grade

In terms of 11th grade, the demographic groups most similar to Immigrants from Spain are Osage (92.7%, a difference of 0.0%), Argentinean (92.7%, a difference of 0.0%), Immigrants from Eastern Asia (92.7%, a difference of 0.0%), Brazilian (92.8%, a difference of 0.010%), and Immigrants from Venezuela (92.7%, a difference of 0.010%).
DemographicsRating | Rank11th Grade
Immigrants | Poland
78.5
/100
|
#149
Good
92.8%
Immigrants | Egypt
77.5
/100
|
#150
Good
92.8%
Potawatomi
74.3
/100
|
#151
Good
92.8%
Iraqis
74.2
/100
|
#152
Good
92.8%
Brazilians
73.9
/100
|
#153
Good
92.8%
Osage
73.4
/100
|
#154
Good
92.7%
Argentineans
73.4
/100
|
#155
Good
92.7%
Immigrants | Spain
73.0
/100
|
#156
Good
92.7%
Immigrants | Eastern Asia
72.6
/100
|
#157
Good
92.7%
Immigrants | Venezuela
72.0
/100
|
#158
Good
92.7%
Americans
71.7
/100
|
#159
Good
92.7%
Immigrants | Lebanon
70.7
/100
|
#160
Good
92.7%
Immigrants | Argentina
69.8
/100
|
#161
Good
92.7%
Paraguayans
68.7
/100
|
#162
Good
92.7%
Immigrants | Nonimmigrants
66.6
/100
|
#163
Good
92.7%

Demographics Similar to Bahamians by 11th Grade

In terms of 11th grade, the demographic groups most similar to Bahamians are South American (91.6%, a difference of 0.020%), Immigrants from Middle Africa (91.6%, a difference of 0.030%), Immigrants from Thailand (91.6%, a difference of 0.060%), Senegalese (91.6%, a difference of 0.070%), and Hopi (91.7%, a difference of 0.080%).
DemographicsRating | Rank11th Grade
Armenians
2.9
/100
|
#234
Tragic
91.7%
Sub-Saharan Africans
2.9
/100
|
#235
Tragic
91.7%
Colombians
2.8
/100
|
#236
Tragic
91.7%
Immigrants | Bolivia
2.8
/100
|
#237
Tragic
91.7%
Comanche
2.6
/100
|
#238
Tragic
91.7%
Hopi
2.5
/100
|
#239
Tragic
91.7%
South Americans
2.0
/100
|
#240
Tragic
91.6%
Bahamians
1.8
/100
|
#241
Tragic
91.6%
Immigrants | Middle Africa
1.6
/100
|
#242
Tragic
91.6%
Immigrants | Thailand
1.4
/100
|
#243
Tragic
91.6%
Senegalese
1.4
/100
|
#244
Tragic
91.6%
Africans
1.3
/100
|
#245
Tragic
91.5%
Seminole
1.2
/100
|
#246
Tragic
91.5%
Immigrants | Philippines
1.0
/100
|
#247
Tragic
91.5%
Immigrants | Uzbekistan
1.0
/100
|
#248
Tragic
91.5%