Syrian vs Tsimshian 7th Grade
COMPARE
Syrian
Tsimshian
7th Grade
7th Grade Comparison
Syrians
Tsimshian
96.5%
7TH GRADE
96.6/ 100
METRIC RATING
116th/ 347
METRIC RANK
97.8%
7TH GRADE
100.0/ 100
METRIC RATING
6th/ 347
METRIC RANK
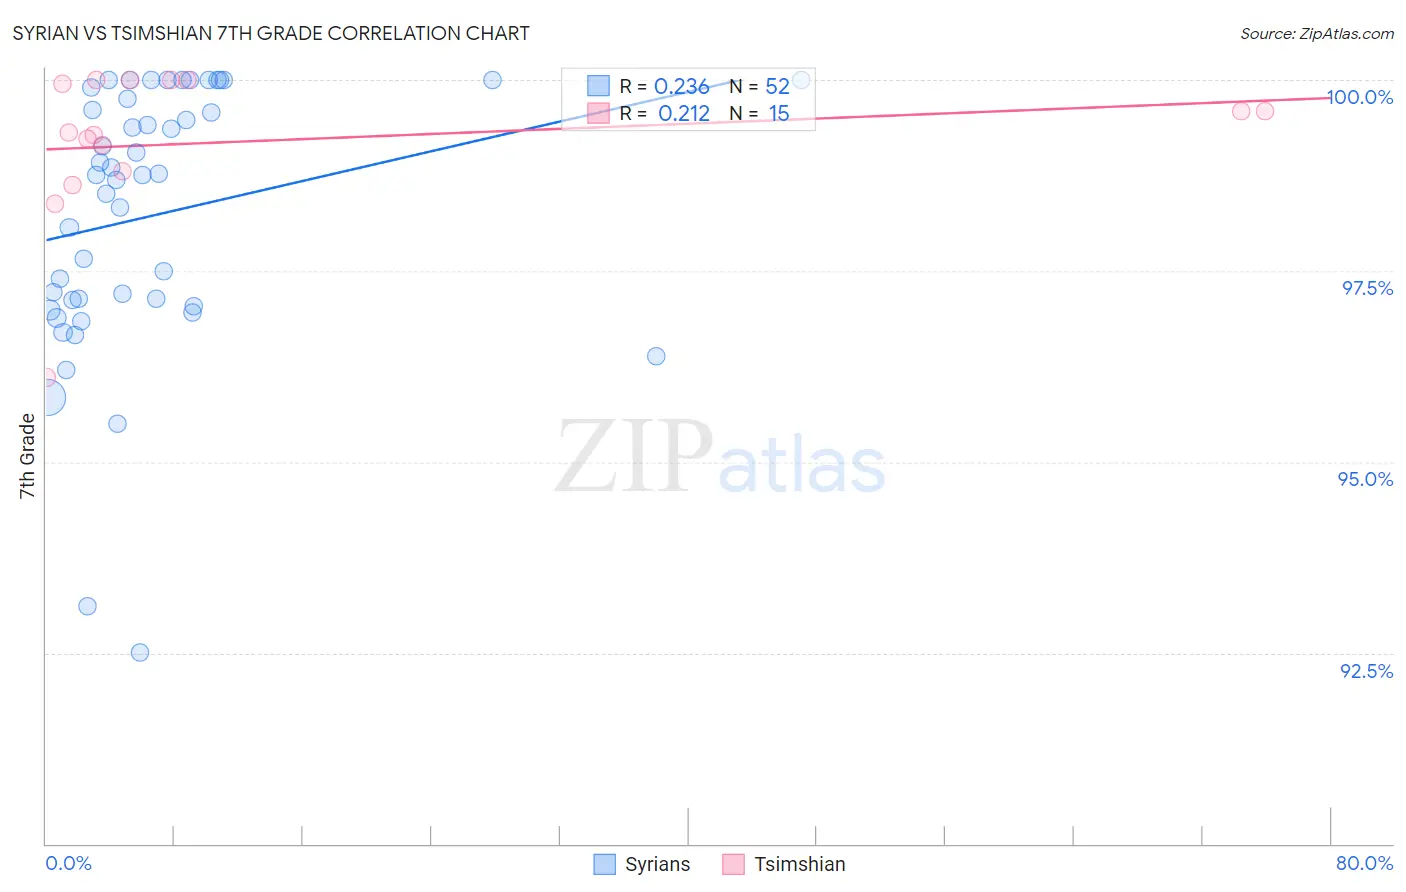
Syrian vs Tsimshian 7th Grade Correlation Chart
The statistical analysis conducted on geographies consisting of 266,305,988 people shows a weak positive correlation between the proportion of Syrians and percentage of population with at least 7th grade education in the United States with a correlation coefficient (R) of 0.236 and weighted average of 96.5%. Similarly, the statistical analysis conducted on geographies consisting of 15,626,544 people shows a weak positive correlation between the proportion of Tsimshian and percentage of population with at least 7th grade education in the United States with a correlation coefficient (R) of 0.212 and weighted average of 97.8%, a difference of 1.3%.
7th Grade Correlation Summary
| Measurement | Syrian | Tsimshian |
| Minimum | 92.5% | 96.1% |
| Maximum | 100.0% | 100.0% |
| Range | 7.5% | 3.9% |
| Mean | 98.2% | 99.2% |
| Median | 98.8% | 99.3% |
| Interquartile 25% (IQ1) | 97.1% | 98.8% |
| Interquartile 75% (IQ3) | 99.8% | 100.0% |
| Interquartile Range (IQR) | 2.7% | 1.2% |
| Standard Deviation (Sample) | 1.7% | 1.0% |
| Standard Deviation (Population) | 1.7% | 0.97% |
Similar Demographics by 7th Grade
Demographics Similar to Syrians by 7th Grade
In terms of 7th grade, the demographic groups most similar to Syrians are Immigrants from Zimbabwe (96.5%, a difference of 0.0%), Choctaw (96.5%, a difference of 0.0%), Pueblo (96.5%, a difference of 0.010%), Nonimmigrants (96.5%, a difference of 0.020%), and Okinawan (96.6%, a difference of 0.040%).
| Demographics | Rating | Rank | 7th Grade |
| Bhutanese | 97.7 /100 | #109 | Exceptional 96.6% |
| Okinawans | 97.4 /100 | #110 | Exceptional 96.6% |
| Immigrants | Latvia | 97.4 /100 | #111 | Exceptional 96.6% |
| Immigrants | Nonimmigrants | 97.0 /100 | #112 | Exceptional 96.5% |
| Pueblo | 96.8 /100 | #113 | Exceptional 96.5% |
| Immigrants | Zimbabwe | 96.6 /100 | #114 | Exceptional 96.5% |
| Choctaw | 96.6 /100 | #115 | Exceptional 96.5% |
| Syrians | 96.6 /100 | #116 | Exceptional 96.5% |
| Immigrants | Moldova | 95.7 /100 | #117 | Exceptional 96.5% |
| Immigrants | Japan | 95.5 /100 | #118 | Exceptional 96.5% |
| Immigrants | Norway | 95.2 /100 | #119 | Exceptional 96.5% |
| Immigrants | Croatia | 95.0 /100 | #120 | Exceptional 96.5% |
| Cheyenne | 94.9 /100 | #121 | Exceptional 96.5% |
| Immigrants | Europe | 94.8 /100 | #122 | Exceptional 96.5% |
| Immigrants | France | 94.7 /100 | #123 | Exceptional 96.5% |
Demographics Similar to Tsimshian by 7th Grade
In terms of 7th grade, the demographic groups most similar to Tsimshian are Norwegian (97.8%, a difference of 0.030%), Slovak (97.8%, a difference of 0.040%), Dutch (97.9%, a difference of 0.060%), German (97.7%, a difference of 0.060%), and Slovene (97.6%, a difference of 0.16%).
| Demographics | Rating | Rank | 7th Grade |
| Crow | 100.0 /100 | #1 | Exceptional 99.1% |
| Finns | 100.0 /100 | #2 | Exceptional 98.5% |
| Carpatho Rusyns | 100.0 /100 | #3 | Exceptional 98.3% |
| Ottawa | 100.0 /100 | #4 | Exceptional 98.1% |
| Dutch | 100.0 /100 | #5 | Exceptional 97.9% |
| Tsimshian | 100.0 /100 | #6 | Exceptional 97.8% |
| Norwegians | 100.0 /100 | #7 | Exceptional 97.8% |
| Slovaks | 100.0 /100 | #8 | Exceptional 97.8% |
| Germans | 100.0 /100 | #9 | Exceptional 97.7% |
| Slovenes | 100.0 /100 | #10 | Exceptional 97.6% |
| Alaskan Athabascans | 100.0 /100 | #11 | Exceptional 97.6% |
| Poles | 100.0 /100 | #12 | Exceptional 97.6% |
| Swedes | 100.0 /100 | #13 | Exceptional 97.6% |
| Pennsylvania Germans | 100.0 /100 | #14 | Exceptional 97.6% |
| English | 100.0 /100 | #15 | Exceptional 97.6% |