Immigrants from Scotland vs Tsimshian 7th Grade
COMPARE
Immigrants from Scotland
Tsimshian
7th Grade
7th Grade Comparison
Immigrants from Scotland
Tsimshian
97.1%
7TH GRADE
99.9/ 100
METRIC RATING
50th/ 347
METRIC RANK
97.8%
7TH GRADE
100.0/ 100
METRIC RATING
6th/ 347
METRIC RANK
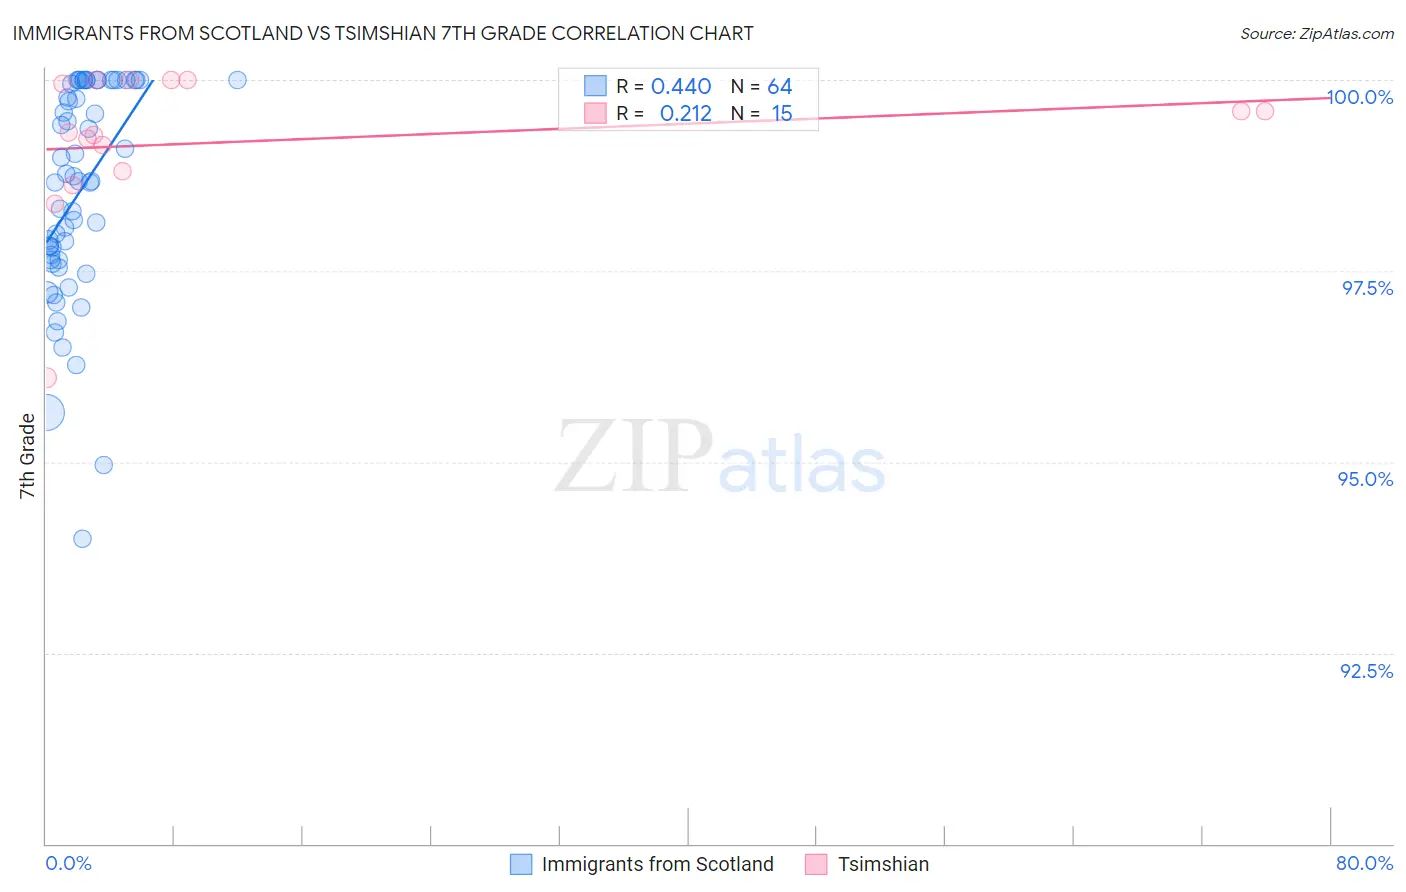
Immigrants from Scotland vs Tsimshian 7th Grade Correlation Chart
The statistical analysis conducted on geographies consisting of 196,398,887 people shows a moderate positive correlation between the proportion of Immigrants from Scotland and percentage of population with at least 7th grade education in the United States with a correlation coefficient (R) of 0.440 and weighted average of 97.1%. Similarly, the statistical analysis conducted on geographies consisting of 15,626,544 people shows a weak positive correlation between the proportion of Tsimshian and percentage of population with at least 7th grade education in the United States with a correlation coefficient (R) of 0.212 and weighted average of 97.8%, a difference of 0.78%.
7th Grade Correlation Summary
| Measurement | Immigrants from Scotland | Tsimshian |
| Minimum | 94.0% | 96.1% |
| Maximum | 100.0% | 100.0% |
| Range | 6.0% | 3.9% |
| Mean | 98.5% | 99.2% |
| Median | 98.7% | 99.3% |
| Interquartile 25% (IQ1) | 97.6% | 98.8% |
| Interquartile 75% (IQ3) | 100.0% | 100.0% |
| Interquartile Range (IQR) | 2.4% | 1.2% |
| Standard Deviation (Sample) | 1.4% | 1.0% |
| Standard Deviation (Population) | 1.4% | 0.97% |
Similar Demographics by 7th Grade
Demographics Similar to Immigrants from Scotland by 7th Grade
In terms of 7th grade, the demographic groups most similar to Immigrants from Scotland are Slavic (97.1%, a difference of 0.0%), Celtic (97.1%, a difference of 0.010%), Bulgarian (97.1%, a difference of 0.020%), Estonian (97.0%, a difference of 0.030%), and Czechoslovakian (97.1%, a difference of 0.040%).
| Demographics | Rating | Rank | 7th Grade |
| Maltese | 99.9 /100 | #43 | Exceptional 97.1% |
| Northern Europeans | 99.9 /100 | #44 | Exceptional 97.1% |
| Czechoslovakians | 99.9 /100 | #45 | Exceptional 97.1% |
| Aleuts | 99.9 /100 | #46 | Exceptional 97.1% |
| Bulgarians | 99.9 /100 | #47 | Exceptional 97.1% |
| Celtics | 99.9 /100 | #48 | Exceptional 97.1% |
| Slavs | 99.9 /100 | #49 | Exceptional 97.1% |
| Immigrants | Scotland | 99.9 /100 | #50 | Exceptional 97.1% |
| Estonians | 99.9 /100 | #51 | Exceptional 97.0% |
| Greeks | 99.9 /100 | #52 | Exceptional 97.0% |
| Austrians | 99.8 /100 | #53 | Exceptional 97.0% |
| Australians | 99.8 /100 | #54 | Exceptional 97.0% |
| Russians | 99.8 /100 | #55 | Exceptional 97.0% |
| Serbians | 99.8 /100 | #56 | Exceptional 97.0% |
| Americans | 99.8 /100 | #57 | Exceptional 97.0% |
Demographics Similar to Tsimshian by 7th Grade
In terms of 7th grade, the demographic groups most similar to Tsimshian are Norwegian (97.8%, a difference of 0.030%), Slovak (97.8%, a difference of 0.040%), Dutch (97.9%, a difference of 0.060%), German (97.7%, a difference of 0.060%), and Slovene (97.6%, a difference of 0.16%).
| Demographics | Rating | Rank | 7th Grade |
| Crow | 100.0 /100 | #1 | Exceptional 99.1% |
| Finns | 100.0 /100 | #2 | Exceptional 98.5% |
| Carpatho Rusyns | 100.0 /100 | #3 | Exceptional 98.3% |
| Ottawa | 100.0 /100 | #4 | Exceptional 98.1% |
| Dutch | 100.0 /100 | #5 | Exceptional 97.9% |
| Tsimshian | 100.0 /100 | #6 | Exceptional 97.8% |
| Norwegians | 100.0 /100 | #7 | Exceptional 97.8% |
| Slovaks | 100.0 /100 | #8 | Exceptional 97.8% |
| Germans | 100.0 /100 | #9 | Exceptional 97.7% |
| Slovenes | 100.0 /100 | #10 | Exceptional 97.6% |
| Alaskan Athabascans | 100.0 /100 | #11 | Exceptional 97.6% |
| Poles | 100.0 /100 | #12 | Exceptional 97.6% |
| Swedes | 100.0 /100 | #13 | Exceptional 97.6% |
| Pennsylvania Germans | 100.0 /100 | #14 | Exceptional 97.6% |
| English | 100.0 /100 | #15 | Exceptional 97.6% |