Honduran vs Mongolian 3rd Grade
COMPARE
Honduran
Mongolian
3rd Grade
3rd Grade Comparison
Hondurans
Mongolians
96.5%
3RD GRADE
0.0/ 100
METRIC RATING
323rd/ 347
METRIC RANK
97.7%
3RD GRADE
29.1/ 100
METRIC RATING
192nd/ 347
METRIC RANK
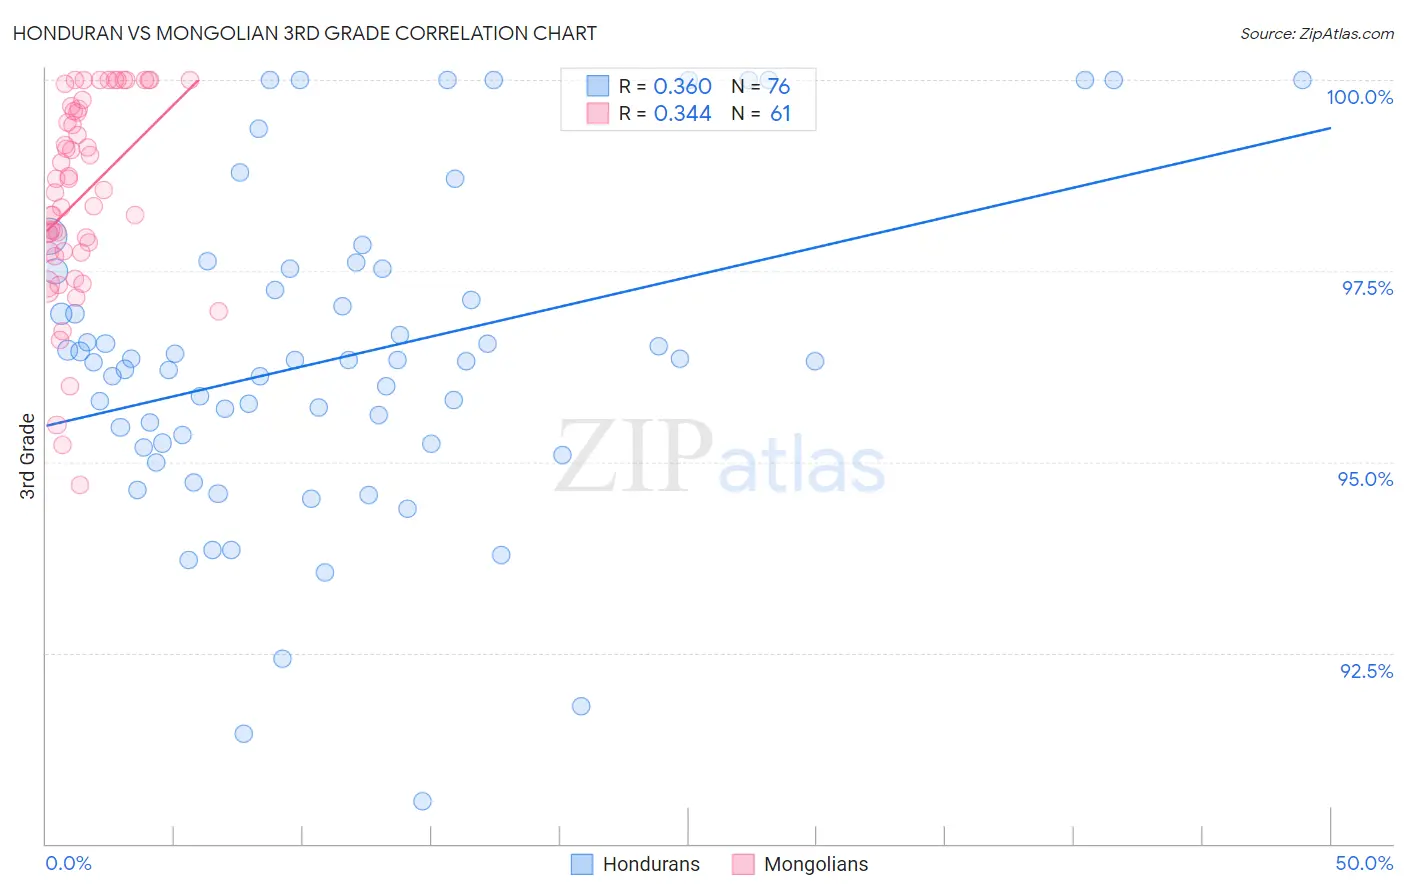
Honduran vs Mongolian 3rd Grade Correlation Chart
The statistical analysis conducted on geographies consisting of 357,784,803 people shows a mild positive correlation between the proportion of Hondurans and percentage of population with at least 3rd grade education in the United States with a correlation coefficient (R) of 0.360 and weighted average of 96.5%. Similarly, the statistical analysis conducted on geographies consisting of 140,362,004 people shows a mild positive correlation between the proportion of Mongolians and percentage of population with at least 3rd grade education in the United States with a correlation coefficient (R) of 0.344 and weighted average of 97.7%, a difference of 1.3%.
3rd Grade Correlation Summary
| Measurement | Honduran | Mongolian |
| Minimum | 90.6% | 94.7% |
| Maximum | 100.0% | 100.0% |
| Range | 9.4% | 5.3% |
| Mean | 96.4% | 98.5% |
| Median | 96.3% | 98.6% |
| Interquartile 25% (IQ1) | 95.2% | 97.7% |
| Interquartile 75% (IQ3) | 97.5% | 99.6% |
| Interquartile Range (IQR) | 2.3% | 1.9% |
| Standard Deviation (Sample) | 2.1% | 1.3% |
| Standard Deviation (Population) | 2.1% | 1.3% |
Similar Demographics by 3rd Grade
Demographics Similar to Hondurans by 3rd Grade
In terms of 3rd grade, the demographic groups most similar to Hondurans are Immigrants from Nicaragua (96.5%, a difference of 0.020%), Indonesian (96.5%, a difference of 0.020%), Immigrants from Belize (96.5%, a difference of 0.020%), Vietnamese (96.5%, a difference of 0.040%), and Hispanic or Latino (96.5%, a difference of 0.050%).
| Demographics | Rating | Rank | 3rd Grade |
| Immigrants | Burma/Myanmar | 0.0 /100 | #316 | Tragic 96.6% |
| Immigrants | Bangladesh | 0.0 /100 | #317 | Tragic 96.6% |
| Hispanics or Latinos | 0.0 /100 | #318 | Tragic 96.5% |
| Vietnamese | 0.0 /100 | #319 | Tragic 96.5% |
| Immigrants | Nicaragua | 0.0 /100 | #320 | Tragic 96.5% |
| Indonesians | 0.0 /100 | #321 | Tragic 96.5% |
| Immigrants | Belize | 0.0 /100 | #322 | Tragic 96.5% |
| Hondurans | 0.0 /100 | #323 | Tragic 96.5% |
| Dominicans | 0.0 /100 | #324 | Tragic 96.4% |
| Mexican American Indians | 0.0 /100 | #325 | Tragic 96.4% |
| Immigrants | Vietnam | 0.0 /100 | #326 | Tragic 96.4% |
| Japanese | 0.0 /100 | #327 | Tragic 96.4% |
| Bangladeshis | 0.0 /100 | #328 | Tragic 96.3% |
| Immigrants | Honduras | 0.0 /100 | #329 | Tragic 96.3% |
| Immigrants | Armenia | 0.0 /100 | #330 | Tragic 96.3% |
Demographics Similar to Mongolians by 3rd Grade
In terms of 3rd grade, the demographic groups most similar to Mongolians are Black/African American (97.7%, a difference of 0.0%), Immigrants from Kenya (97.7%, a difference of 0.0%), Panamanian (97.7%, a difference of 0.010%), Immigrants from Uganda (97.7%, a difference of 0.010%), and Immigrants from Egypt (97.7%, a difference of 0.010%).
| Demographics | Rating | Rank | 3rd Grade |
| Immigrants | Argentina | 37.0 /100 | #185 | Fair 97.7% |
| Portuguese | 36.2 /100 | #186 | Fair 97.7% |
| Natives/Alaskans | 35.2 /100 | #187 | Fair 97.7% |
| Immigrants | Taiwan | 34.2 /100 | #188 | Fair 97.7% |
| Pakistanis | 34.2 /100 | #189 | Fair 97.7% |
| Panamanians | 31.5 /100 | #190 | Fair 97.7% |
| Blacks/African Americans | 29.6 /100 | #191 | Fair 97.7% |
| Mongolians | 29.1 /100 | #192 | Fair 97.7% |
| Immigrants | Kenya | 28.2 /100 | #193 | Fair 97.7% |
| Immigrants | Uganda | 27.4 /100 | #194 | Fair 97.7% |
| Immigrants | Egypt | 26.8 /100 | #195 | Fair 97.7% |
| Paraguayans | 26.2 /100 | #196 | Fair 97.7% |
| Hawaiians | 25.7 /100 | #197 | Fair 97.7% |
| Guamanians/Chamorros | 23.6 /100 | #198 | Fair 97.7% |
| Immigrants | Ukraine | 22.7 /100 | #199 | Fair 97.7% |