Sudanese vs Maltese Nursery School
COMPARE
Sudanese
Maltese
Nursery School
Nursery School Comparison
Sudanese
Maltese
97.7%
NURSERY SCHOOL
3.2/ 100
METRIC RATING
228th/ 347
METRIC RANK
98.4%
NURSERY SCHOOL
99.7/ 100
METRIC RATING
65th/ 347
METRIC RANK
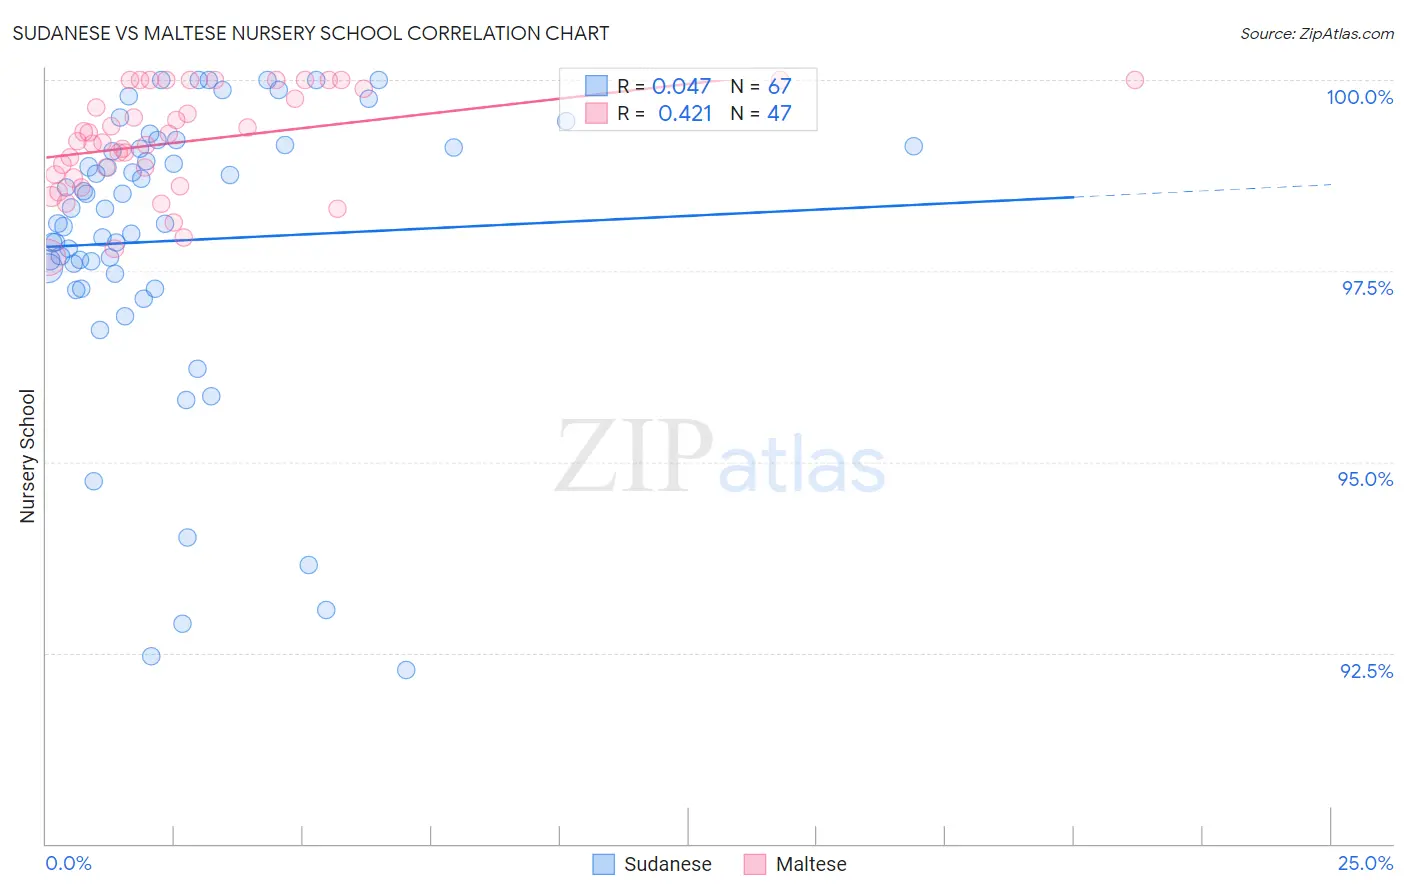
Sudanese vs Maltese Nursery School Correlation Chart
The statistical analysis conducted on geographies consisting of 110,145,984 people shows no correlation between the proportion of Sudanese and percentage of population with at least nursery school education in the United States with a correlation coefficient (R) of 0.047 and weighted average of 97.7%. Similarly, the statistical analysis conducted on geographies consisting of 126,476,608 people shows a moderate positive correlation between the proportion of Maltese and percentage of population with at least nursery school education in the United States with a correlation coefficient (R) of 0.421 and weighted average of 98.4%, a difference of 0.70%.
Nursery School Correlation Summary
| Measurement | Sudanese | Maltese |
| Minimum | 92.3% | 97.7% |
| Maximum | 100.0% | 100.0% |
| Range | 7.7% | 2.3% |
| Mean | 97.9% | 99.2% |
| Median | 98.3% | 99.2% |
| Interquartile 25% (IQ1) | 97.5% | 98.7% |
| Interquartile 75% (IQ3) | 99.1% | 100.0% |
| Interquartile Range (IQR) | 1.7% | 1.3% |
| Standard Deviation (Sample) | 1.9% | 0.67% |
| Standard Deviation (Population) | 1.9% | 0.66% |
Similar Demographics by Nursery School
Demographics Similar to Sudanese by Nursery School
In terms of nursery school, the demographic groups most similar to Sudanese are Subsaharan African (97.7%, a difference of 0.0%), Senegalese (97.7%, a difference of 0.0%), Immigrants from Nepal (97.7%, a difference of 0.010%), Immigrants from Costa Rica (97.7%, a difference of 0.010%), and Iraqi (97.7%, a difference of 0.010%).
| Demographics | Rating | Rank | Nursery School |
| Tongans | 4.3 /100 | #221 | Tragic 97.8% |
| Immigrants | Syria | 4.0 /100 | #222 | Tragic 97.7% |
| Immigrants | Sudan | 3.9 /100 | #223 | Tragic 97.7% |
| Immigrants | Nepal | 3.6 /100 | #224 | Tragic 97.7% |
| Immigrants | Costa Rica | 3.5 /100 | #225 | Tragic 97.7% |
| Iraqis | 3.5 /100 | #226 | Tragic 97.7% |
| Sub-Saharan Africans | 3.2 /100 | #227 | Tragic 97.7% |
| Sudanese | 3.2 /100 | #228 | Tragic 97.7% |
| Senegalese | 3.2 /100 | #229 | Tragic 97.7% |
| Sierra Leoneans | 2.9 /100 | #230 | Tragic 97.7% |
| Puerto Ricans | 2.6 /100 | #231 | Tragic 97.7% |
| Immigrants | Uruguay | 2.3 /100 | #232 | Tragic 97.7% |
| U.S. Virgin Islanders | 2.1 /100 | #233 | Tragic 97.7% |
| Colombians | 2.1 /100 | #234 | Tragic 97.7% |
| Immigrants | Pakistan | 2.1 /100 | #235 | Tragic 97.7% |
Demographics Similar to Maltese by Nursery School
In terms of nursery school, the demographic groups most similar to Maltese are New Zealander (98.4%, a difference of 0.0%), Creek (98.4%, a difference of 0.0%), Immigrants from North America (98.4%, a difference of 0.0%), Greek (98.4%, a difference of 0.0%), and Bulgarian (98.4%, a difference of 0.010%).
| Demographics | Rating | Rank | Nursery School |
| Bulgarians | 99.8 /100 | #58 | Exceptional 98.4% |
| Immigrants | Canada | 99.8 /100 | #59 | Exceptional 98.4% |
| Slavs | 99.8 /100 | #60 | Exceptional 98.4% |
| New Zealanders | 99.7 /100 | #61 | Exceptional 98.4% |
| Creek | 99.7 /100 | #62 | Exceptional 98.4% |
| Immigrants | North America | 99.7 /100 | #63 | Exceptional 98.4% |
| Greeks | 99.7 /100 | #64 | Exceptional 98.4% |
| Maltese | 99.7 /100 | #65 | Exceptional 98.4% |
| Canadians | 99.7 /100 | #66 | Exceptional 98.4% |
| Immigrants | Northern Europe | 99.6 /100 | #67 | Exceptional 98.4% |
| Russians | 99.6 /100 | #68 | Exceptional 98.4% |
| Immigrants | Austria | 99.6 /100 | #69 | Exceptional 98.4% |
| Cheyenne | 99.6 /100 | #70 | Exceptional 98.4% |
| Serbians | 99.6 /100 | #71 | Exceptional 98.4% |
| Chickasaw | 99.6 /100 | #72 | Exceptional 98.4% |