Alaskan Athabascan vs Central American Indian Doctorate Degree
COMPARE
Alaskan Athabascan
Central American Indian
Doctorate Degree
Doctorate Degree Comparison
Alaskan Athabascans
Central American Indians
1.7%
DOCTORATE DEGREE
13.8/ 100
METRIC RATING
215th/ 347
METRIC RANK
1.5%
DOCTORATE DEGREE
1.0/ 100
METRIC RATING
256th/ 347
METRIC RANK
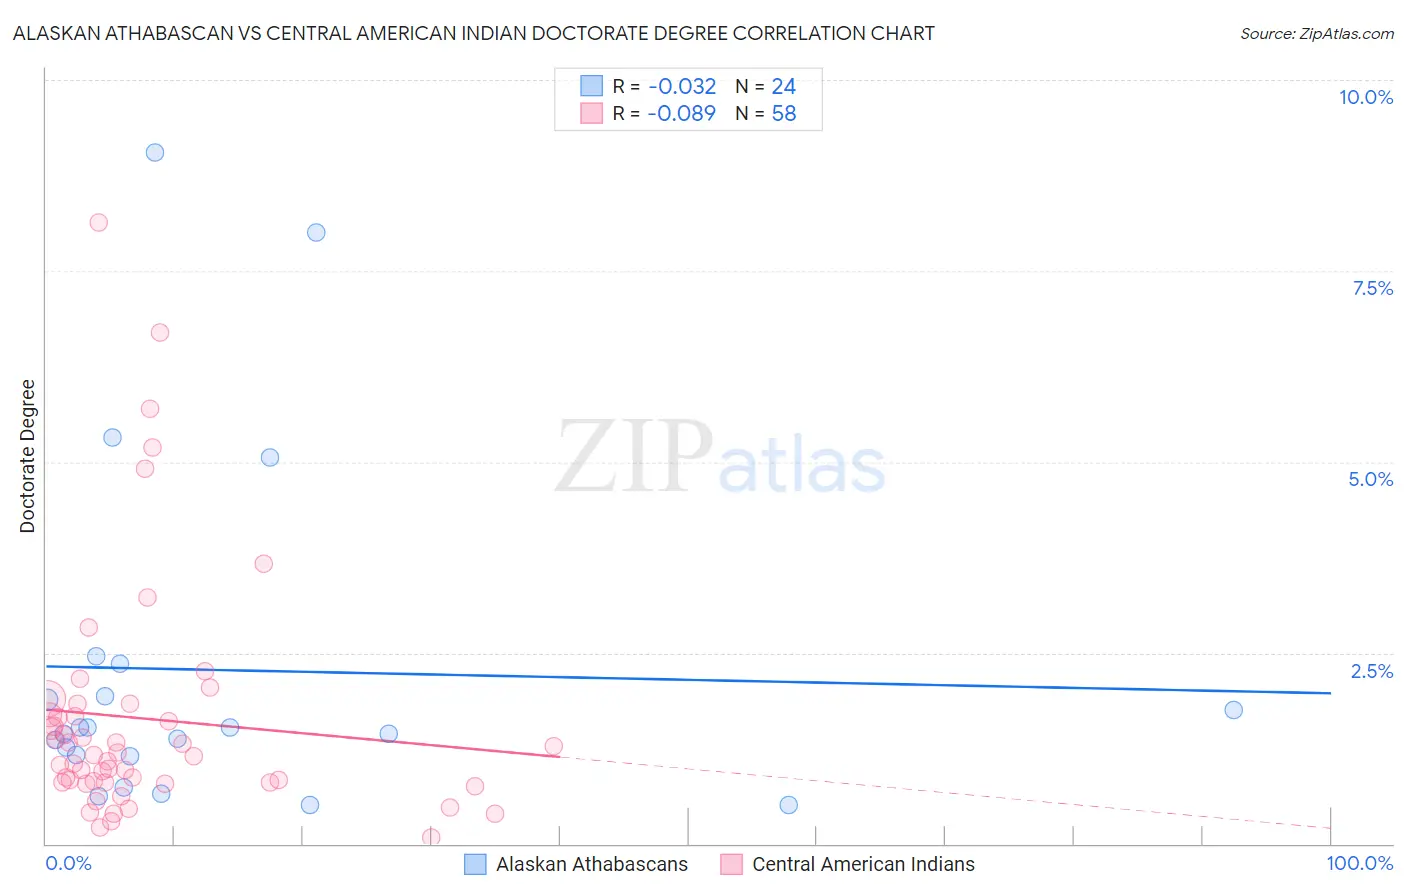
Alaskan Athabascan vs Central American Indian Doctorate Degree Correlation Chart
The statistical analysis conducted on geographies consisting of 45,553,512 people shows no correlation between the proportion of Alaskan Athabascans and percentage of population with at least doctorate degree education in the United States with a correlation coefficient (R) of -0.032 and weighted average of 1.7%. Similarly, the statistical analysis conducted on geographies consisting of 323,048,918 people shows a slight negative correlation between the proportion of Central American Indians and percentage of population with at least doctorate degree education in the United States with a correlation coefficient (R) of -0.089 and weighted average of 1.5%, a difference of 12.3%.
Doctorate Degree Correlation Summary
| Measurement | Alaskan Athabascan | Central American Indian |
| Minimum | 0.51% | 0.089% |
| Maximum | 9.0% | 8.1% |
| Range | 8.5% | 8.0% |
| Mean | 2.3% | 1.6% |
| Median | 1.5% | 1.2% |
| Interquartile 25% (IQ1) | 1.2% | 0.81% |
| Interquartile 75% (IQ3) | 2.1% | 1.7% |
| Interquartile Range (IQR) | 0.98% | 0.88% |
| Standard Deviation (Sample) | 2.3% | 1.6% |
| Standard Deviation (Population) | 2.2% | 1.6% |
Similar Demographics by Doctorate Degree
Demographics Similar to Alaskan Athabascans by Doctorate Degree
In terms of doctorate degree, the demographic groups most similar to Alaskan Athabascans are Immigrants from Burma/Myanmar (1.7%, a difference of 0.10%), Pueblo (1.7%, a difference of 0.14%), Korean (1.7%, a difference of 0.15%), Immigrants from South Eastern Asia (1.7%, a difference of 0.29%), and Spanish American (1.7%, a difference of 0.31%).
| Demographics | Rating | Rank | Doctorate Degree |
| Colombians | 16.1 /100 | #208 | Poor 1.7% |
| Immigrants | Western Africa | 15.4 /100 | #209 | Poor 1.7% |
| Tongans | 15.1 /100 | #210 | Poor 1.7% |
| Immigrants | Armenia | 15.1 /100 | #211 | Poor 1.7% |
| Immigrants | South Eastern Asia | 14.7 /100 | #212 | Poor 1.7% |
| Koreans | 14.2 /100 | #213 | Poor 1.7% |
| Pueblo | 14.2 /100 | #214 | Poor 1.7% |
| Alaskan Athabascans | 13.8 /100 | #215 | Poor 1.7% |
| Immigrants | Burma/Myanmar | 13.5 /100 | #216 | Poor 1.7% |
| Spanish Americans | 12.9 /100 | #217 | Poor 1.7% |
| Tlingit-Haida | 11.9 /100 | #218 | Poor 1.7% |
| Immigrants | Iraq | 10.7 /100 | #219 | Poor 1.7% |
| Immigrants | Uruguay | 9.2 /100 | #220 | Tragic 1.7% |
| Immigrants | Nonimmigrants | 8.8 /100 | #221 | Tragic 1.7% |
| Immigrants | Venezuela | 8.7 /100 | #222 | Tragic 1.7% |
Demographics Similar to Central American Indians by Doctorate Degree
In terms of doctorate degree, the demographic groups most similar to Central American Indians are Immigrants from Cambodia (1.5%, a difference of 0.050%), Trinidadian and Tobagonian (1.5%, a difference of 0.050%), American (1.5%, a difference of 0.18%), Chippewa (1.5%, a difference of 0.22%), and Yuman (1.5%, a difference of 0.33%).
| Demographics | Rating | Rank | Doctorate Degree |
| Potawatomi | 1.6 /100 | #249 | Tragic 1.6% |
| Immigrants | Fiji | 1.6 /100 | #250 | Tragic 1.6% |
| Apache | 1.3 /100 | #251 | Tragic 1.5% |
| Yuman | 1.1 /100 | #252 | Tragic 1.5% |
| Americans | 1.0 /100 | #253 | Tragic 1.5% |
| Immigrants | Cambodia | 1.0 /100 | #254 | Tragic 1.5% |
| Trinidadians and Tobagonians | 1.0 /100 | #255 | Tragic 1.5% |
| Central American Indians | 1.0 /100 | #256 | Tragic 1.5% |
| Chippewa | 0.9 /100 | #257 | Tragic 1.5% |
| Immigrants | West Indies | 0.9 /100 | #258 | Tragic 1.5% |
| Liberians | 0.9 /100 | #259 | Tragic 1.5% |
| Japanese | 0.9 /100 | #260 | Tragic 1.5% |
| Immigrants | Portugal | 0.8 /100 | #261 | Tragic 1.5% |
| Chickasaw | 0.7 /100 | #262 | Tragic 1.5% |
| Immigrants | Bahamas | 0.7 /100 | #263 | Tragic 1.5% |