Paraguayan vs Immigrants from Sri Lanka Kindergarten
COMPARE
Paraguayan
Immigrants from Sri Lanka
Kindergarten
Kindergarten Comparison
Paraguayans
Immigrants from Sri Lanka
97.9%
KINDERGARTEN
29.6/ 100
METRIC RATING
193rd/ 347
METRIC RANK
97.9%
KINDERGARTEN
49.6/ 100
METRIC RATING
175th/ 347
METRIC RANK
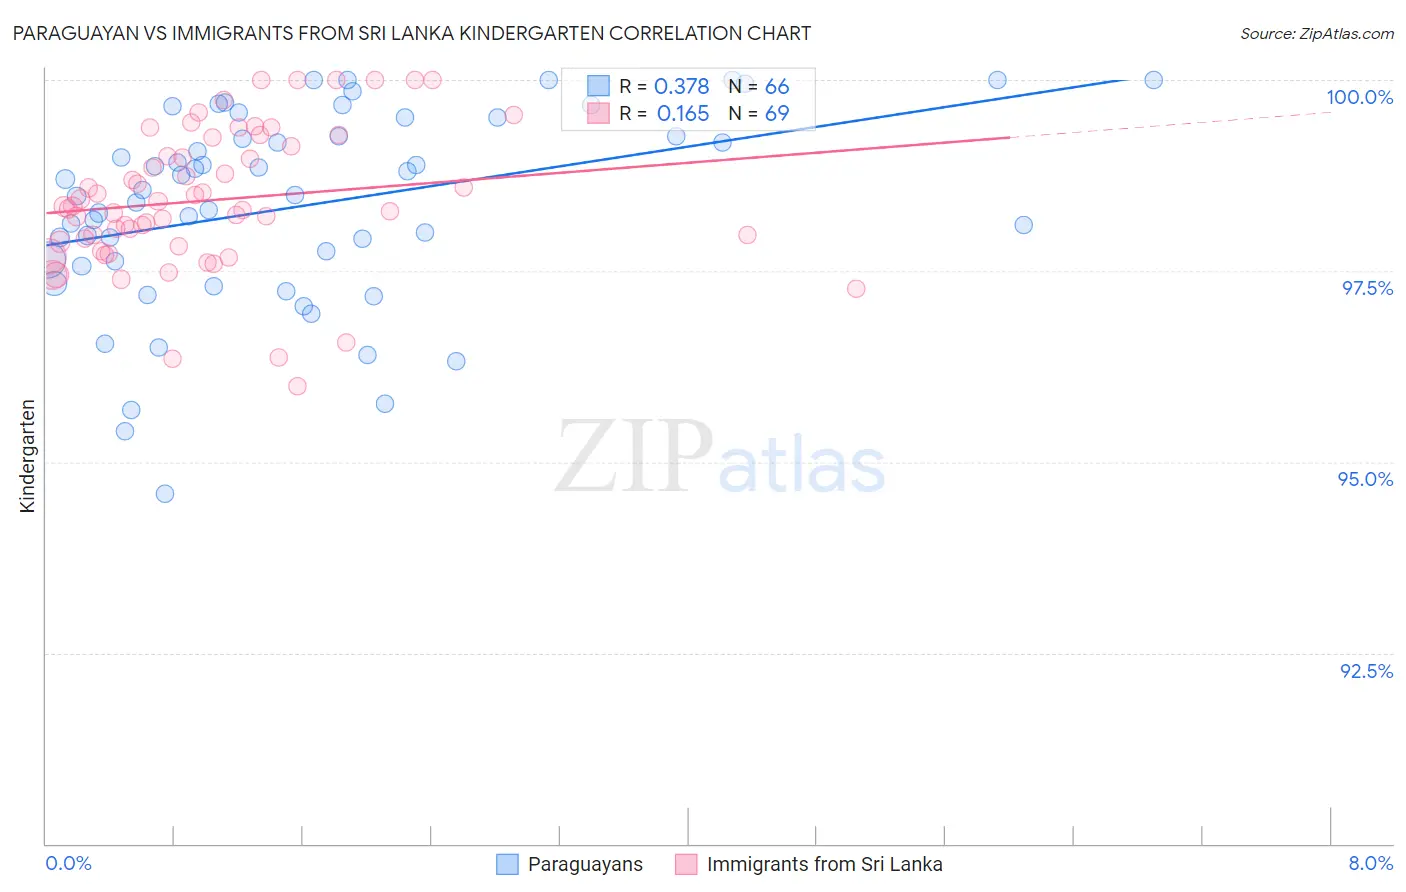
Paraguayan vs Immigrants from Sri Lanka Kindergarten Correlation Chart
The statistical analysis conducted on geographies consisting of 95,114,254 people shows a mild positive correlation between the proportion of Paraguayans and percentage of population with at least kindergarten education in the United States with a correlation coefficient (R) of 0.378 and weighted average of 97.9%. Similarly, the statistical analysis conducted on geographies consisting of 149,700,552 people shows a poor positive correlation between the proportion of Immigrants from Sri Lanka and percentage of population with at least kindergarten education in the United States with a correlation coefficient (R) of 0.165 and weighted average of 97.9%, a difference of 0.070%.
Kindergarten Correlation Summary
| Measurement | Paraguayan | Immigrants from Sri Lanka |
| Minimum | 94.6% | 96.0% |
| Maximum | 100.0% | 100.0% |
| Range | 5.4% | 4.0% |
| Mean | 98.4% | 98.4% |
| Median | 98.5% | 98.3% |
| Interquartile 25% (IQ1) | 97.6% | 97.9% |
| Interquartile 75% (IQ3) | 99.3% | 99.2% |
| Interquartile Range (IQR) | 1.6% | 1.3% |
| Standard Deviation (Sample) | 1.3% | 0.92% |
| Standard Deviation (Population) | 1.3% | 0.91% |
Demographics Similar to Paraguayans and Immigrants from Sri Lanka by Kindergarten
In terms of kindergarten, the demographic groups most similar to Paraguayans are Immigrants from Taiwan (97.9%, a difference of 0.0%), Black/African American (97.9%, a difference of 0.0%), Hawaiian (97.9%, a difference of 0.0%), Panamanian (97.9%, a difference of 0.010%), and Pakistani (97.9%, a difference of 0.020%). Similarly, the demographic groups most similar to Immigrants from Sri Lanka are Immigrants from Brazil (98.0%, a difference of 0.0%), Albanian (97.9%, a difference of 0.0%), Immigrants from Venezuela (97.9%, a difference of 0.010%), Brazilian (97.9%, a difference of 0.010%), and Argentinean (97.9%, a difference of 0.010%).
| Demographics | Rating | Rank | Kindergarten |
| Immigrants | Brazil | 50.0 /100 | #174 | Average 98.0% |
| Immigrants | Sri Lanka | 49.6 /100 | #175 | Average 97.9% |
| Albanians | 48.5 /100 | #176 | Average 97.9% |
| Immigrants | Venezuela | 47.9 /100 | #177 | Average 97.9% |
| Brazilians | 47.6 /100 | #178 | Average 97.9% |
| Argentineans | 46.8 /100 | #179 | Average 97.9% |
| Immigrants | Bosnia and Herzegovina | 46.7 /100 | #180 | Average 97.9% |
| Portuguese | 43.5 /100 | #181 | Average 97.9% |
| Egyptians | 42.4 /100 | #182 | Average 97.9% |
| Immigrants | Poland | 41.4 /100 | #183 | Average 97.9% |
| Immigrants | Argentina | 40.7 /100 | #184 | Average 97.9% |
| Immigrants | Belarus | 39.4 /100 | #185 | Fair 97.9% |
| Pakistanis | 36.0 /100 | #186 | Fair 97.9% |
| Immigrants | Kazakhstan | 35.9 /100 | #187 | Fair 97.9% |
| Arabs | 35.4 /100 | #188 | Fair 97.9% |
| Paiute | 34.7 /100 | #189 | Fair 97.9% |
| Panamanians | 33.3 /100 | #190 | Fair 97.9% |
| Immigrants | Taiwan | 30.7 /100 | #191 | Fair 97.9% |
| Blacks/African Americans | 29.9 /100 | #192 | Fair 97.9% |
| Paraguayans | 29.6 /100 | #193 | Fair 97.9% |
| Hawaiians | 29.3 /100 | #194 | Fair 97.9% |