Aleut vs Immigrants from Sri Lanka Kindergarten
COMPARE
Aleut
Immigrants from Sri Lanka
Kindergarten
Kindergarten Comparison
Aleuts
Immigrants from Sri Lanka
98.6%
KINDERGARTEN
100.0/ 100
METRIC RATING
16th/ 347
METRIC RANK
97.9%
KINDERGARTEN
49.6/ 100
METRIC RATING
175th/ 347
METRIC RANK
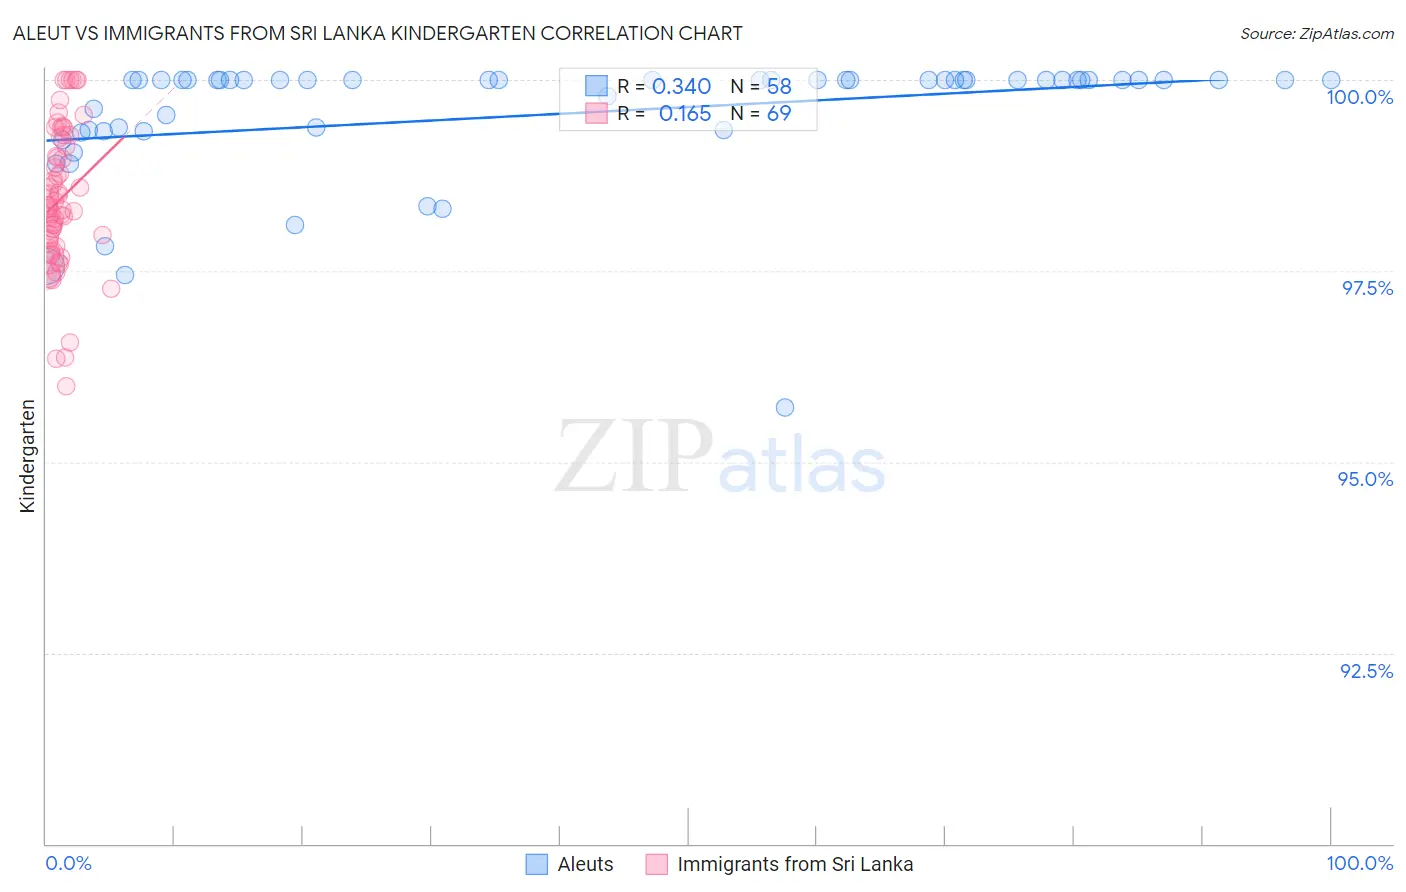
Aleut vs Immigrants from Sri Lanka Kindergarten Correlation Chart
The statistical analysis conducted on geographies consisting of 61,781,127 people shows a mild positive correlation between the proportion of Aleuts and percentage of population with at least kindergarten education in the United States with a correlation coefficient (R) of 0.340 and weighted average of 98.6%. Similarly, the statistical analysis conducted on geographies consisting of 149,700,552 people shows a poor positive correlation between the proportion of Immigrants from Sri Lanka and percentage of population with at least kindergarten education in the United States with a correlation coefficient (R) of 0.165 and weighted average of 97.9%, a difference of 0.71%.
Kindergarten Correlation Summary
| Measurement | Aleut | Immigrants from Sri Lanka |
| Minimum | 95.7% | 96.0% |
| Maximum | 100.0% | 100.0% |
| Range | 4.3% | 4.0% |
| Mean | 99.5% | 98.4% |
| Median | 100.0% | 98.3% |
| Interquartile 25% (IQ1) | 99.3% | 97.9% |
| Interquartile 75% (IQ3) | 100.0% | 99.2% |
| Interquartile Range (IQR) | 0.65% | 1.3% |
| Standard Deviation (Sample) | 0.84% | 0.92% |
| Standard Deviation (Population) | 0.83% | 0.91% |
Similar Demographics by Kindergarten
Demographics Similar to Aleuts by Kindergarten
In terms of kindergarten, the demographic groups most similar to Aleuts are Scottish (98.6%, a difference of 0.0%), Swedish (98.7%, a difference of 0.010%), Dutch (98.6%, a difference of 0.010%), Carpatho Rusyn (98.7%, a difference of 0.030%), and English (98.7%, a difference of 0.030%).
| Demographics | Rating | Rank | Kindergarten |
| Tlingit-Haida | 100.0 /100 | #9 | Exceptional 98.7% |
| Slovaks | 100.0 /100 | #10 | Exceptional 98.7% |
| Germans | 100.0 /100 | #11 | Exceptional 98.7% |
| Slovenes | 100.0 /100 | #12 | Exceptional 98.7% |
| Carpatho Rusyns | 100.0 /100 | #13 | Exceptional 98.7% |
| English | 100.0 /100 | #14 | Exceptional 98.7% |
| Swedes | 100.0 /100 | #15 | Exceptional 98.7% |
| Aleuts | 100.0 /100 | #16 | Exceptional 98.6% |
| Scottish | 100.0 /100 | #17 | Exceptional 98.6% |
| Dutch | 100.0 /100 | #18 | Exceptional 98.6% |
| Irish | 100.0 /100 | #19 | Exceptional 98.6% |
| Pennsylvania Germans | 100.0 /100 | #20 | Exceptional 98.6% |
| Lithuanians | 100.0 /100 | #21 | Exceptional 98.6% |
| Finns | 100.0 /100 | #22 | Exceptional 98.6% |
| Arapaho | 100.0 /100 | #23 | Exceptional 98.6% |
Demographics Similar to Immigrants from Sri Lanka by Kindergarten
In terms of kindergarten, the demographic groups most similar to Immigrants from Sri Lanka are Native/Alaskan (98.0%, a difference of 0.0%), Kenyan (98.0%, a difference of 0.0%), Immigrants from Brazil (98.0%, a difference of 0.0%), Albanian (97.9%, a difference of 0.0%), and Navajo (98.0%, a difference of 0.010%).
| Demographics | Rating | Rank | Kindergarten |
| Navajo | 54.4 /100 | #168 | Average 98.0% |
| Immigrants | Korea | 54.1 /100 | #169 | Average 98.0% |
| Bermudans | 54.0 /100 | #170 | Average 98.0% |
| Immigrants | Jordan | 54.0 /100 | #171 | Average 98.0% |
| Natives/Alaskans | 51.0 /100 | #172 | Average 98.0% |
| Kenyans | 51.0 /100 | #173 | Average 98.0% |
| Immigrants | Brazil | 50.0 /100 | #174 | Average 98.0% |
| Immigrants | Sri Lanka | 49.6 /100 | #175 | Average 97.9% |
| Albanians | 48.5 /100 | #176 | Average 97.9% |
| Immigrants | Venezuela | 47.9 /100 | #177 | Average 97.9% |
| Brazilians | 47.6 /100 | #178 | Average 97.9% |
| Argentineans | 46.8 /100 | #179 | Average 97.9% |
| Immigrants | Bosnia and Herzegovina | 46.7 /100 | #180 | Average 97.9% |
| Portuguese | 43.5 /100 | #181 | Average 97.9% |
| Egyptians | 42.4 /100 | #182 | Average 97.9% |