Paraguayan vs Uruguayan Kindergarten
COMPARE
Paraguayan
Uruguayan
Kindergarten
Kindergarten Comparison
Paraguayans
Uruguayans
97.9%
KINDERGARTEN
29.6/ 100
METRIC RATING
193rd/ 347
METRIC RANK
97.8%
KINDERGARTEN
7.5/ 100
METRIC RATING
214th/ 347
METRIC RANK
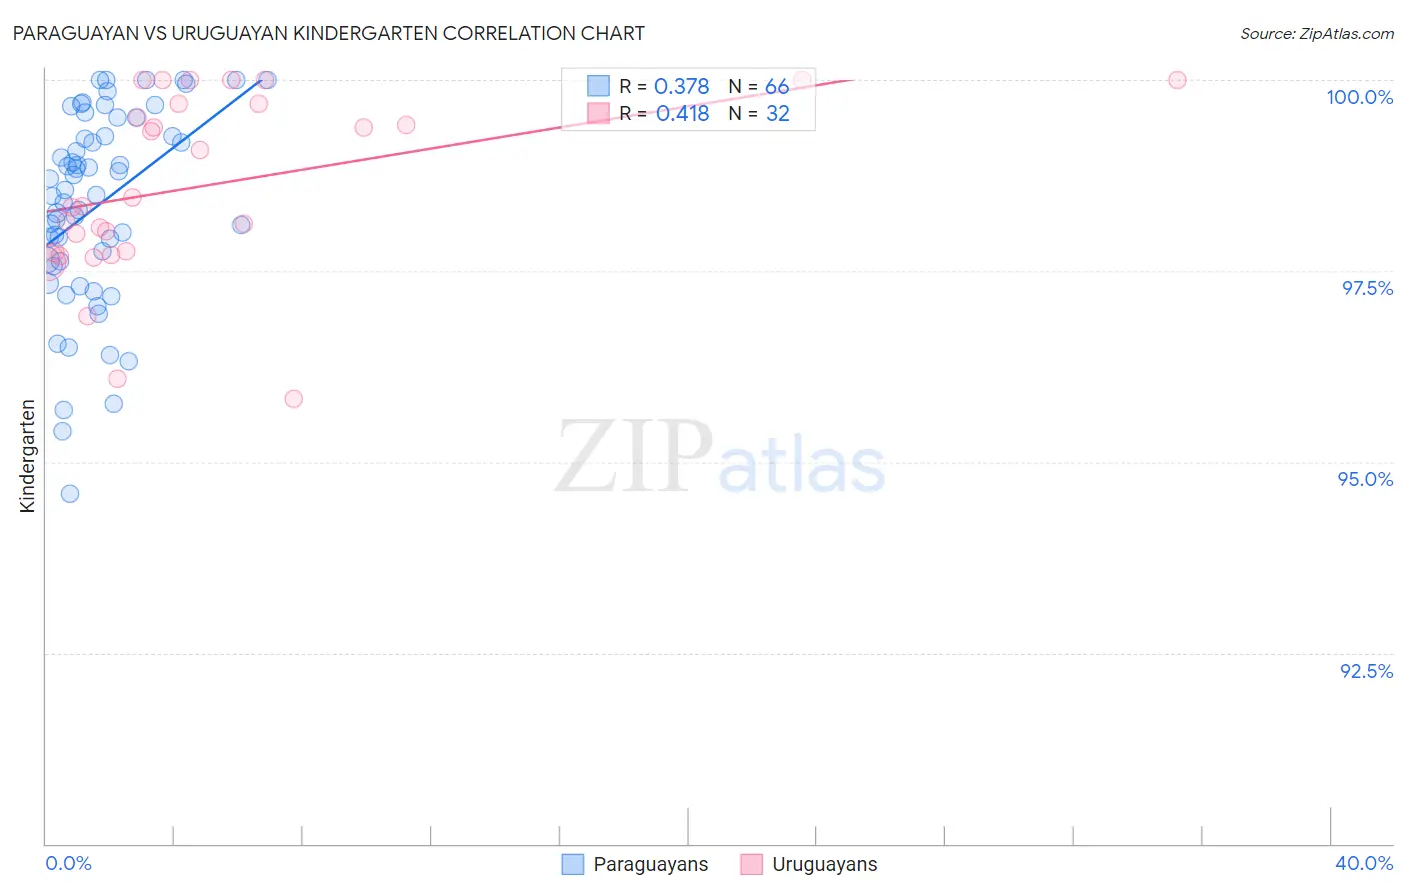
Paraguayan vs Uruguayan Kindergarten Correlation Chart
The statistical analysis conducted on geographies consisting of 95,114,254 people shows a mild positive correlation between the proportion of Paraguayans and percentage of population with at least kindergarten education in the United States with a correlation coefficient (R) of 0.378 and weighted average of 97.9%. Similarly, the statistical analysis conducted on geographies consisting of 144,782,794 people shows a moderate positive correlation between the proportion of Uruguayans and percentage of population with at least kindergarten education in the United States with a correlation coefficient (R) of 0.418 and weighted average of 97.8%, a difference of 0.13%.
Kindergarten Correlation Summary
| Measurement | Paraguayan | Uruguayan |
| Minimum | 94.6% | 95.8% |
| Maximum | 100.0% | 100.0% |
| Range | 5.4% | 4.2% |
| Mean | 98.4% | 98.6% |
| Median | 98.5% | 98.4% |
| Interquartile 25% (IQ1) | 97.6% | 97.8% |
| Interquartile 75% (IQ3) | 99.3% | 99.7% |
| Interquartile Range (IQR) | 1.6% | 1.9% |
| Standard Deviation (Sample) | 1.3% | 1.2% |
| Standard Deviation (Population) | 1.3% | 1.2% |
Similar Demographics by Kindergarten
Demographics Similar to Paraguayans by Kindergarten
In terms of kindergarten, the demographic groups most similar to Paraguayans are Immigrants from Taiwan (97.9%, a difference of 0.0%), Black/African American (97.9%, a difference of 0.0%), Hawaiian (97.9%, a difference of 0.0%), Mongolian (97.9%, a difference of 0.0%), and Panamanian (97.9%, a difference of 0.010%).
| Demographics | Rating | Rank | Kindergarten |
| Pakistanis | 36.0 /100 | #186 | Fair 97.9% |
| Immigrants | Kazakhstan | 35.9 /100 | #187 | Fair 97.9% |
| Arabs | 35.4 /100 | #188 | Fair 97.9% |
| Paiute | 34.7 /100 | #189 | Fair 97.9% |
| Panamanians | 33.3 /100 | #190 | Fair 97.9% |
| Immigrants | Taiwan | 30.7 /100 | #191 | Fair 97.9% |
| Blacks/African Americans | 29.9 /100 | #192 | Fair 97.9% |
| Paraguayans | 29.6 /100 | #193 | Fair 97.9% |
| Hawaiians | 29.3 /100 | #194 | Fair 97.9% |
| Mongolians | 28.9 /100 | #195 | Fair 97.9% |
| Guamanians/Chamorros | 26.2 /100 | #196 | Fair 97.9% |
| Immigrants | Kenya | 25.5 /100 | #197 | Fair 97.9% |
| Tohono O'odham | 24.6 /100 | #198 | Fair 97.9% |
| Immigrants | Egypt | 22.3 /100 | #199 | Fair 97.9% |
| Yuman | 21.6 /100 | #200 | Fair 97.9% |
Demographics Similar to Uruguayans by Kindergarten
In terms of kindergarten, the demographic groups most similar to Uruguayans are South American Indian (97.8%, a difference of 0.0%), Immigrants from Bahamas (97.8%, a difference of 0.0%), Moroccan (97.8%, a difference of 0.010%), Samoan (97.8%, a difference of 0.010%), and Bahamian (97.8%, a difference of 0.010%).
| Demographics | Rating | Rank | Kindergarten |
| Africans | 16.1 /100 | #207 | Poor 97.8% |
| Immigrants | Northern Africa | 12.0 /100 | #208 | Poor 97.8% |
| Costa Ricans | 11.6 /100 | #209 | Poor 97.8% |
| Immigrants | Oceania | 11.1 /100 | #210 | Poor 97.8% |
| Laotians | 10.5 /100 | #211 | Poor 97.8% |
| Moroccans | 8.9 /100 | #212 | Tragic 97.8% |
| South American Indians | 7.7 /100 | #213 | Tragic 97.8% |
| Uruguayans | 7.5 /100 | #214 | Tragic 97.8% |
| Immigrants | Bahamas | 7.4 /100 | #215 | Tragic 97.8% |
| Samoans | 6.9 /100 | #216 | Tragic 97.8% |
| Bahamians | 6.6 /100 | #217 | Tragic 97.8% |
| Immigrants | Morocco | 5.4 /100 | #218 | Tragic 97.7% |
| Immigrants | Panama | 5.0 /100 | #219 | Tragic 97.7% |
| Tongans | 4.8 /100 | #220 | Tragic 97.7% |
| Immigrants | Zaire | 4.5 /100 | #221 | Tragic 97.7% |