Immigrants from Eastern Asia vs Immigrants from Sri Lanka Kindergarten
COMPARE
Immigrants from Eastern Asia
Immigrants from Sri Lanka
Kindergarten
Kindergarten Comparison
Immigrants from Eastern Asia
Immigrants from Sri Lanka
97.6%
KINDERGARTEN
1.7/ 100
METRIC RATING
238th/ 347
METRIC RANK
97.9%
KINDERGARTEN
49.6/ 100
METRIC RATING
175th/ 347
METRIC RANK
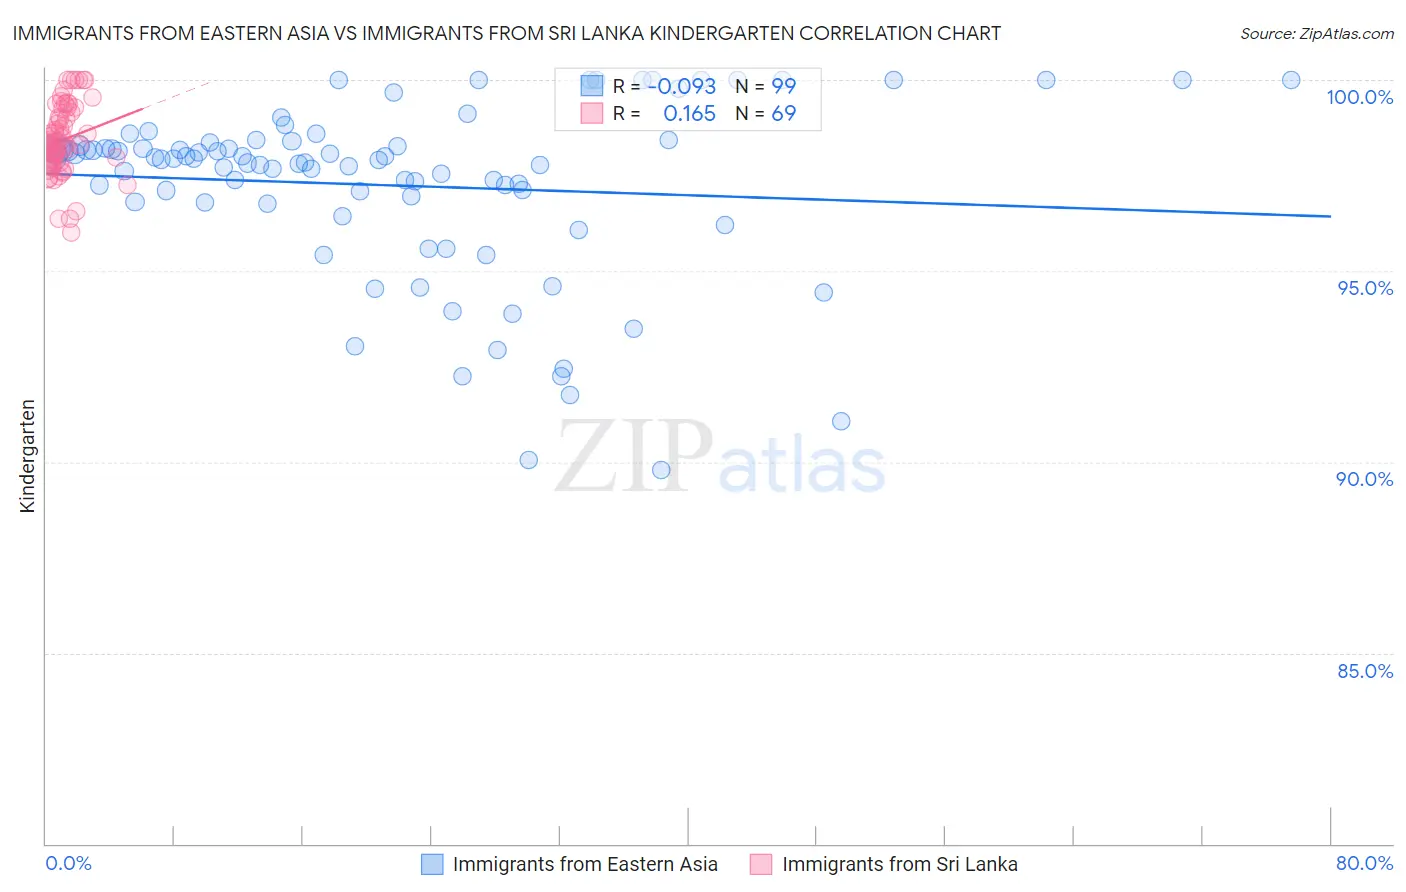
Immigrants from Eastern Asia vs Immigrants from Sri Lanka Kindergarten Correlation Chart
The statistical analysis conducted on geographies consisting of 499,865,893 people shows a slight negative correlation between the proportion of Immigrants from Eastern Asia and percentage of population with at least kindergarten education in the United States with a correlation coefficient (R) of -0.093 and weighted average of 97.6%. Similarly, the statistical analysis conducted on geographies consisting of 149,700,552 people shows a poor positive correlation between the proportion of Immigrants from Sri Lanka and percentage of population with at least kindergarten education in the United States with a correlation coefficient (R) of 0.165 and weighted average of 97.9%, a difference of 0.31%.
Kindergarten Correlation Summary
| Measurement | Immigrants from Eastern Asia | Immigrants from Sri Lanka |
| Minimum | 89.8% | 96.0% |
| Maximum | 100.0% | 100.0% |
| Range | 10.2% | 4.0% |
| Mean | 97.2% | 98.4% |
| Median | 97.9% | 98.3% |
| Interquartile 25% (IQ1) | 96.8% | 97.9% |
| Interquartile 75% (IQ3) | 98.4% | 99.2% |
| Interquartile Range (IQR) | 1.6% | 1.3% |
| Standard Deviation (Sample) | 2.3% | 0.92% |
| Standard Deviation (Population) | 2.3% | 0.91% |
Similar Demographics by Kindergarten
Demographics Similar to Immigrants from Eastern Asia by Kindergarten
In terms of kindergarten, the demographic groups most similar to Immigrants from Eastern Asia are Nigerian (97.6%, a difference of 0.0%), U.S. Virgin Islander (97.6%, a difference of 0.0%), Korean (97.6%, a difference of 0.010%), Immigrants from Pakistan (97.7%, a difference of 0.020%), and Immigrants from Malaysia (97.7%, a difference of 0.020%).
| Demographics | Rating | Rank | Kindergarten |
| Puerto Ricans | 2.7 /100 | #231 | Tragic 97.7% |
| Immigrants | Uruguay | 2.6 /100 | #232 | Tragic 97.7% |
| Immigrants | Pakistan | 2.2 /100 | #233 | Tragic 97.7% |
| Immigrants | Malaysia | 2.2 /100 | #234 | Tragic 97.7% |
| Colombians | 2.2 /100 | #235 | Tragic 97.7% |
| Immigrants | Western Asia | 2.1 /100 | #236 | Tragic 97.7% |
| Nigerians | 1.8 /100 | #237 | Tragic 97.6% |
| Immigrants | Eastern Asia | 1.7 /100 | #238 | Tragic 97.6% |
| U.S. Virgin Islanders | 1.7 /100 | #239 | Tragic 97.6% |
| Koreans | 1.6 /100 | #240 | Tragic 97.6% |
| Liberians | 1.3 /100 | #241 | Tragic 97.6% |
| Immigrants | Indonesia | 1.3 /100 | #242 | Tragic 97.6% |
| Asians | 1.2 /100 | #243 | Tragic 97.6% |
| Bolivians | 1.2 /100 | #244 | Tragic 97.6% |
| South Americans | 1.1 /100 | #245 | Tragic 97.6% |
Demographics Similar to Immigrants from Sri Lanka by Kindergarten
In terms of kindergarten, the demographic groups most similar to Immigrants from Sri Lanka are Native/Alaskan (98.0%, a difference of 0.0%), Kenyan (98.0%, a difference of 0.0%), Immigrants from Brazil (98.0%, a difference of 0.0%), Albanian (97.9%, a difference of 0.0%), and Navajo (98.0%, a difference of 0.010%).
| Demographics | Rating | Rank | Kindergarten |
| Navajo | 54.4 /100 | #168 | Average 98.0% |
| Immigrants | Korea | 54.1 /100 | #169 | Average 98.0% |
| Bermudans | 54.0 /100 | #170 | Average 98.0% |
| Immigrants | Jordan | 54.0 /100 | #171 | Average 98.0% |
| Natives/Alaskans | 51.0 /100 | #172 | Average 98.0% |
| Kenyans | 51.0 /100 | #173 | Average 98.0% |
| Immigrants | Brazil | 50.0 /100 | #174 | Average 98.0% |
| Immigrants | Sri Lanka | 49.6 /100 | #175 | Average 97.9% |
| Albanians | 48.5 /100 | #176 | Average 97.9% |
| Immigrants | Venezuela | 47.9 /100 | #177 | Average 97.9% |
| Brazilians | 47.6 /100 | #178 | Average 97.9% |
| Argentineans | 46.8 /100 | #179 | Average 97.9% |
| Immigrants | Bosnia and Herzegovina | 46.7 /100 | #180 | Average 97.9% |
| Portuguese | 43.5 /100 | #181 | Average 97.9% |
| Egyptians | 42.4 /100 | #182 | Average 97.9% |