Immigrants from Northern Africa vs Immigrants from Guyana College, 1 year or more

COMPARE

Immigrants from Northern Africa
Race
Ancestry
AfghanAfricanAlaska NativeAlaskan AthabascanAlbanianAleutAlsatianAmericanApacheArabArapahoArgentineanArmenianAssyrian/Chaldean/SyriacAustralianAustrianBahamianBangladeshiBarbadianBasqueBelgianBelizeanBermudanBhutaneseBlackfeetBolivianBrazilianBritishBritish West IndianBulgarianBurmeseCajunCambodianCanadianCape VerdeanCarpatho RusynCelticCentral AmericanCentral American IndianCherokeeCheyenneChickasawChileanChineseChippewaChoctawColombianColvilleComancheCosta RicanCreeCreekCroatianCrowCubanCypriotCzechCzechoslovakianDanishDelawareDominicanDutchDutch West IndianEastern EuropeanEcuadorianEgyptianEnglishEstonianEthiopianEuropeanFijianFilipinoFinnishFrenchFrench American IndianFrench CanadianGermanGerman RussianGhanaianGreekGuamanian/ChamorroGuatemalanGuyaneseHaitianHmongHonduranHopiHoumaHungarianIcelanderIndian (Asian)IndonesianInupiatIranianIraqiIrishIroquoisIsraeliItalianJamaicanJapaneseJordanianKenyanKiowaKoreanLaotianLatvianLebaneseLiberianLithuanianLumbeeLuxembourgerMacedonianMalaysianMalteseMarshalleseMenomineeMexicanMexican American IndianMongolianMoroccanNative HawaiianNavajoNepaleseNew ZealanderNicaraguanNigerianNorthern EuropeanNorwegianOkinawanOsageOttawaPaiutePakistaniPalestinianPanamanianParaguayanPennsylvania GermanPeruvianPimaPolishPortuguesePotawatomiPuebloPuerto RicanPuget Sound SalishRomanianRussianSalvadoranSamoanScandinavianScotch-IrishScottishSeminoleSenegaleseSerbianShoshoneSierra LeoneanSiouxSlavicSlovakSloveneSomaliSouth AfricanSouth AmericanSouth American IndianSoviet UnionSpaniardSpanishSpanish AmericanSpanish American IndianSri LankanSubsaharan AfricanSudaneseSwedishSwissSyrianTaiwaneseThaiTlingit-HaidaTohono O'OdhamTonganTrinidadian and TobagonianTsimshianTurkishU.S. Virgin IslanderUgandanUkrainianUruguayanUteVenezuelanVietnameseWelshWest IndianYakamaYaquiYugoslavianYumanYup'ikZimbabwean
Immigration
NonimmigrantsImmigrantsAfghanistanAfricaAlbaniaArgentinaArmeniaAsiaAustraliaAustriaBahamasBangladeshBarbadosBelarusBelgiumBelizeBoliviaBosnia and HerzegovinaBrazilBulgariaBurma/MyanmarCabo VerdeCambodiaCameroonCanadaCaribbeanCentral AmericaChileChinaColombiaCongoCosta RicaCroatiaCubaCzechoslovakiaDenmarkDominicaDominican RepublicEastern AfricaEastern AsiaEastern EuropeEcuadorEgyptEl SalvadorEnglandEritreaEthiopiaEuropeFijiFranceGermanyGhanaGreeceGrenadaGuatemalaHaitiHondurasHong KongHungaryIndiaIndonesiaIranIraqIrelandIsraelItalyJamaicaJapanJordanKazakhstanKenyaKoreaKuwaitLaosLatin AmericaLatviaLebanonLiberiaLithuaniaMalaysiaMexicoMicronesiaMiddle AfricaMoldovaMoroccoNepalNetherlandsNicaraguaNigeriaNorth AmericaNorth MacedoniaNorthern AfricaNorthern EuropeNorwayOceaniaPakistanPanamaPeruPhilippinesPolandPortugalRomaniaRussiaSaudi ArabiaScotlandSenegalSerbiaSierra LeoneSingaporeSomaliaSouth AfricaSouth AmericaSouth Central AsiaSouth Eastern AsiaSouthern EuropeSpainSri LankaSt. Vincent and the GrenadinesSudanSwedenSwitzerlandSyriaTaiwanThailandTrinidad and TobagoTurkeyUgandaUkraineUruguayUzbekistanVenezuelaVietnamWest IndiesWestern AfricaWestern AsiaWestern EuropeYemenZaireZimbabweAzores
Immigrants from Guyana
Race
Ancestry
AfghanAfricanAlaska NativeAlaskan AthabascanAlbanianAleutAlsatianAmericanApacheArabArapahoArgentineanArmenianAssyrian/Chaldean/SyriacAustralianAustrianBahamianBangladeshiBarbadianBasqueBelgianBelizeanBermudanBhutaneseBlackfeetBolivianBrazilianBritishBritish West IndianBulgarianBurmeseCajunCambodianCanadianCape VerdeanCarpatho RusynCelticCentral AmericanCentral American IndianCherokeeCheyenneChickasawChileanChineseChippewaChoctawColombianColvilleComancheCosta RicanCreeCreekCroatianCrowCubanCypriotCzechCzechoslovakianDanishDelawareDominicanDutchDutch West IndianEastern EuropeanEcuadorianEgyptianEnglishEstonianEthiopianEuropeanFijianFilipinoFinnishFrenchFrench American IndianFrench CanadianGermanGerman RussianGhanaianGreekGuamanian/ChamorroGuatemalanGuyaneseHaitianHmongHonduranHopiHoumaHungarianIcelanderIndian (Asian)IndonesianInupiatIranianIraqiIrishIroquoisIsraeliItalianJamaicanJapaneseJordanianKenyanKiowaKoreanLaotianLatvianLebaneseLiberianLithuanianLumbeeLuxembourgerMacedonianMalaysianMalteseMarshalleseMenomineeMexicanMexican American IndianMongolianMoroccanNative HawaiianNavajoNepaleseNew ZealanderNicaraguanNigerianNorthern EuropeanNorwegianOkinawanOsageOttawaPaiutePakistaniPalestinianPanamanianParaguayanPennsylvania GermanPeruvianPimaPolishPortuguesePotawatomiPuebloPuerto RicanPuget Sound SalishRomanianRussianSalvadoranSamoanScandinavianScotch-IrishScottishSeminoleSenegaleseSerbianShoshoneSierra LeoneanSiouxSlavicSlovakSloveneSomaliSouth AfricanSouth AmericanSouth American IndianSoviet UnionSpaniardSpanishSpanish AmericanSpanish American IndianSri LankanSubsaharan AfricanSudaneseSwedishSwissSyrianTaiwaneseThaiTlingit-HaidaTohono O'OdhamTonganTrinidadian and TobagonianTsimshianTurkishU.S. Virgin IslanderUgandanUkrainianUruguayanUteVenezuelanVietnameseWelshWest IndianYakamaYaquiYugoslavianYumanYup'ikZimbabwean
Immigration
NonimmigrantsImmigrantsAfghanistanAfricaAlbaniaArgentinaArmeniaAsiaAustraliaAustriaBahamasBangladeshBarbadosBelarusBelgiumBelizeBoliviaBosnia and HerzegovinaBrazilBulgariaBurma/MyanmarCabo VerdeCambodiaCameroonCanadaCaribbeanCentral AmericaChileChinaColombiaCongoCosta RicaCroatiaCubaCzechoslovakiaDenmarkDominicaDominican RepublicEastern AfricaEastern AsiaEastern EuropeEcuadorEgyptEl SalvadorEnglandEritreaEthiopiaEuropeFijiFranceGermanyGhanaGreeceGrenadaGuatemalaGuyanaHaitiHondurasHong KongHungaryIndiaIndonesiaIranIraqIrelandIsraelItalyJamaicaJapanJordanKazakhstanKenyaKoreaKuwaitLaosLatin AmericaLatviaLebanonLiberiaLithuaniaMalaysiaMexicoMicronesiaMiddle AfricaMoldovaMoroccoNepalNetherlandsNicaraguaNigeriaNorth AmericaNorth MacedoniaNorthern EuropeNorwayOceaniaPakistanPanamaPeruPhilippinesPolandPortugalRomaniaRussiaSaudi ArabiaScotlandSenegalSerbiaSierra LeoneSingaporeSomaliaSouth AfricaSouth AmericaSouth Central AsiaSouth Eastern AsiaSouthern EuropeSpainSri LankaSt. Vincent and the GrenadinesSudanSwedenSwitzerlandSyriaTaiwanThailandTrinidad and TobagoTurkeyUgandaUkraineUruguayUzbekistanVenezuelaVietnamWest IndiesWestern AfricaWestern AsiaWestern EuropeYemenZaireZimbabweAzores
College, 1 year or more
Income
Poverty
Unemployment
Labor Participation
Family Structure
Vehicle Availability
Education Level
Disability

College, 1 year or more Comparison

Immigrants from Northern Africa

Immigrants from Guyana

Exceptional
Tragic
61.9%
COLLEGE, 1 YEAR OR MORE
95.7/ 100
METRIC RATING
109th/ 347
METRIC RANK
53.5%
COLLEGE, 1 YEAR OR MORE
0.1/ 100
METRIC RATING
285th/ 347
METRIC RANK

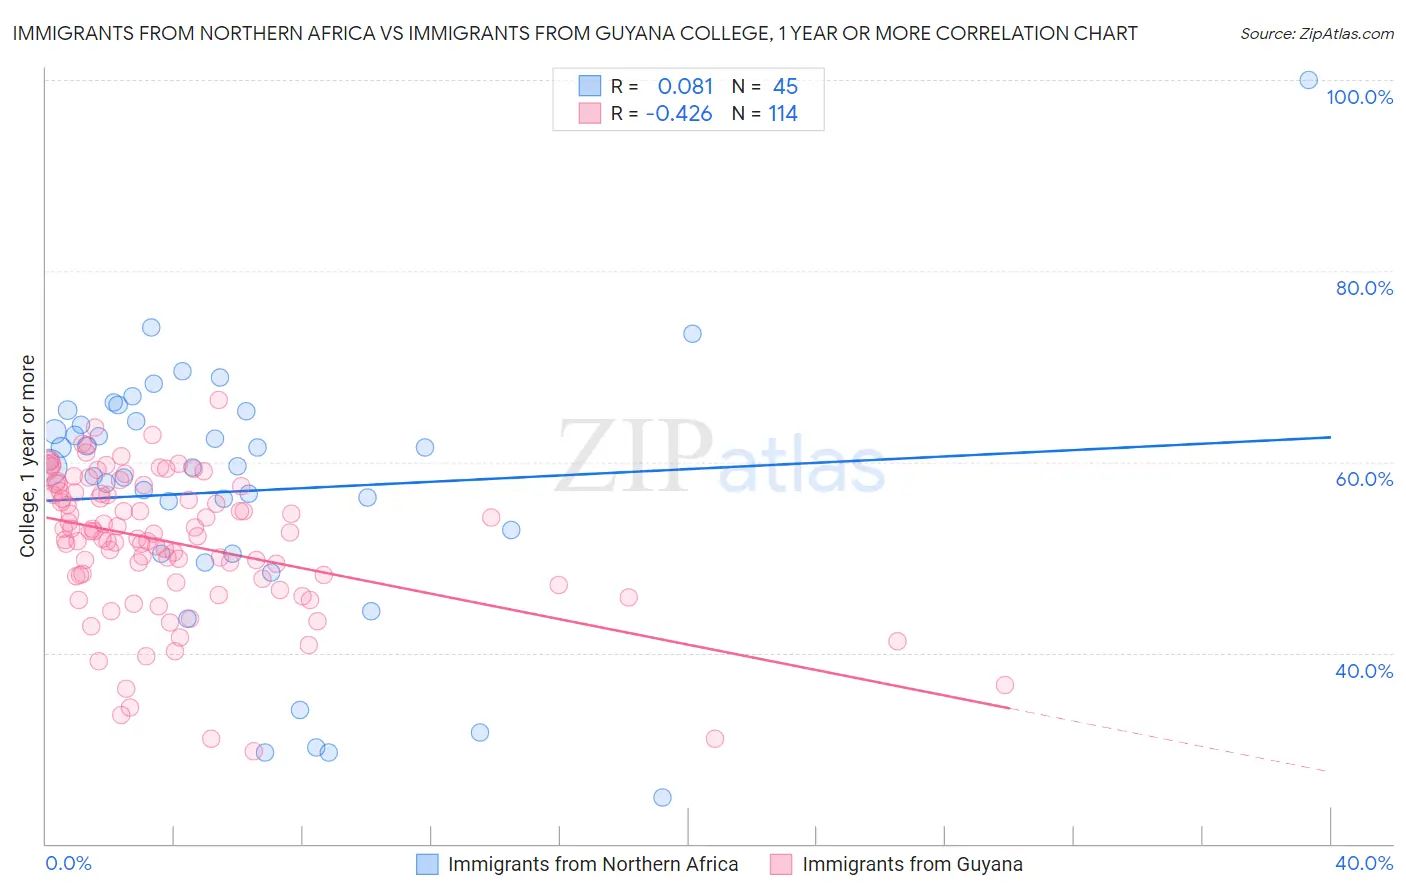
Immigrants from Northern Africa vs Immigrants from Guyana College, 1 year or more Correlation Chart

The statistical analysis conducted on geographies consisting of 321,198,131 people shows a slight positive correlation between the proportion of Immigrants from Northern Africa and percentage of population with at least college, 1 year or more education in the United States with a correlation coefficient (R) of 0.081 and weighted average of 61.9%. Similarly, the statistical analysis conducted on geographies consisting of 183,735,121 people shows a moderate negative correlation between the proportion of Immigrants from Guyana and percentage of population with at least college, 1 year or more education in the United States with a correlation coefficient (R) of -0.426 and weighted average of 53.5%, a difference of 15.5%.
Immigrants from Northern Africa vs Immigrants from Guyana College, 1 year or more

College, 1 year or more Correlation Summary

MeasurementImmigrants from Northern AfricaImmigrants from Guyana
Minimum24.8%29.6%
Maximum100.0%66.5%
Range75.2%36.8%
Mean57.0%51.5%
Median59.4%52.6%
Interquartile 25% (IQ1)50.4%47.8%
Interquartile 75% (IQ3)64.8%57.0%
Interquartile Range (IQR)14.4%9.2%
Standard Deviation (Sample)14.0%7.4%
Standard Deviation (Population)13.8%7.4%

Similar Demographics by College, 1 year or more

Demographics Similar to Immigrants from Northern Africa by College, 1 year or more

In terms of college, 1 year or more, the demographic groups most similar to Immigrants from Northern Africa are Syrian (61.9%, a difference of 0.0%), Immigrants from Ukraine (61.9%, a difference of 0.020%), European (61.8%, a difference of 0.020%), Macedonian (61.8%, a difference of 0.020%), and Austrian (61.8%, a difference of 0.080%).
DemographicsRating | RankCollege, 1 year or more
Luxembourgers
96.7
/100
|
#102
Exceptional
62.1%
Afghans
96.4
/100
|
#103
Exceptional
62.0%
Chileans
96.4
/100
|
#104
Exceptional
62.0%
Immigrants | Nepal
96.3
/100
|
#105
Exceptional
62.0%
Palestinians
96.3
/100
|
#106
Exceptional
62.0%
Immigrants | Ukraine
95.8
/100
|
#107
Exceptional
61.9%
Syrians
95.7
/100
|
#108
Exceptional
61.9%
Immigrants | Northern Africa
95.7
/100
|
#109
Exceptional
61.9%
Europeans
95.6
/100
|
#110
Exceptional
61.8%
Macedonians
95.6
/100
|
#111
Exceptional
61.8%
Austrians
95.4
/100
|
#112
Exceptional
61.8%
Ukrainians
95.2
/100
|
#113
Exceptional
61.8%
Danes
94.8
/100
|
#114
Exceptional
61.7%
Norwegians
94.5
/100
|
#115
Exceptional
61.7%
Lebanese
94.1
/100
|
#116
Exceptional
61.6%

Demographics Similar to Immigrants from Guyana by College, 1 year or more

In terms of college, 1 year or more, the demographic groups most similar to Immigrants from Guyana are Central American Indian (53.5%, a difference of 0.040%), Immigrants from Belize (53.5%, a difference of 0.080%), Alaska Native (53.4%, a difference of 0.25%), Immigrants from Ecuador (53.4%, a difference of 0.25%), and Alaskan Athabascan (53.4%, a difference of 0.27%).
DemographicsRating | RankCollege, 1 year or more
Immigrants | Jamaica
0.1
/100
|
#278
Tragic
54.2%
Arapaho
0.1
/100
|
#279
Tragic
54.1%
Cheyenne
0.1
/100
|
#280
Tragic
54.1%
Colville
0.1
/100
|
#281
Tragic
54.1%
Guyanese
0.1
/100
|
#282
Tragic
54.1%
Nicaraguans
0.1
/100
|
#283
Tragic
53.9%
Ute
0.1
/100
|
#284
Tragic
53.8%
Immigrants | Guyana
0.1
/100
|
#285
Tragic
53.5%
Central American Indians
0.1
/100
|
#286
Tragic
53.5%
Immigrants | Belize
0.1
/100
|
#287
Tragic
53.5%
Alaska Natives
0.0
/100
|
#288
Tragic
53.4%
Immigrants | Ecuador
0.0
/100
|
#289
Tragic
53.4%
Alaskan Athabascans
0.0
/100
|
#290
Tragic
53.4%
Cubans
0.0
/100
|
#291
Tragic
53.4%
Chickasaw
0.0
/100
|
#292
Tragic
53.3%