Panamanian vs Immigrants from Bangladesh 10th Grade
COMPARE
Panamanian
Immigrants from Bangladesh
10th Grade
10th Grade Comparison
Panamanians
Immigrants from Bangladesh
93.5%
10TH GRADE
28.0/ 100
METRIC RATING
193rd/ 347
METRIC RANK
91.0%
10TH GRADE
0.0/ 100
METRIC RATING
308th/ 347
METRIC RANK
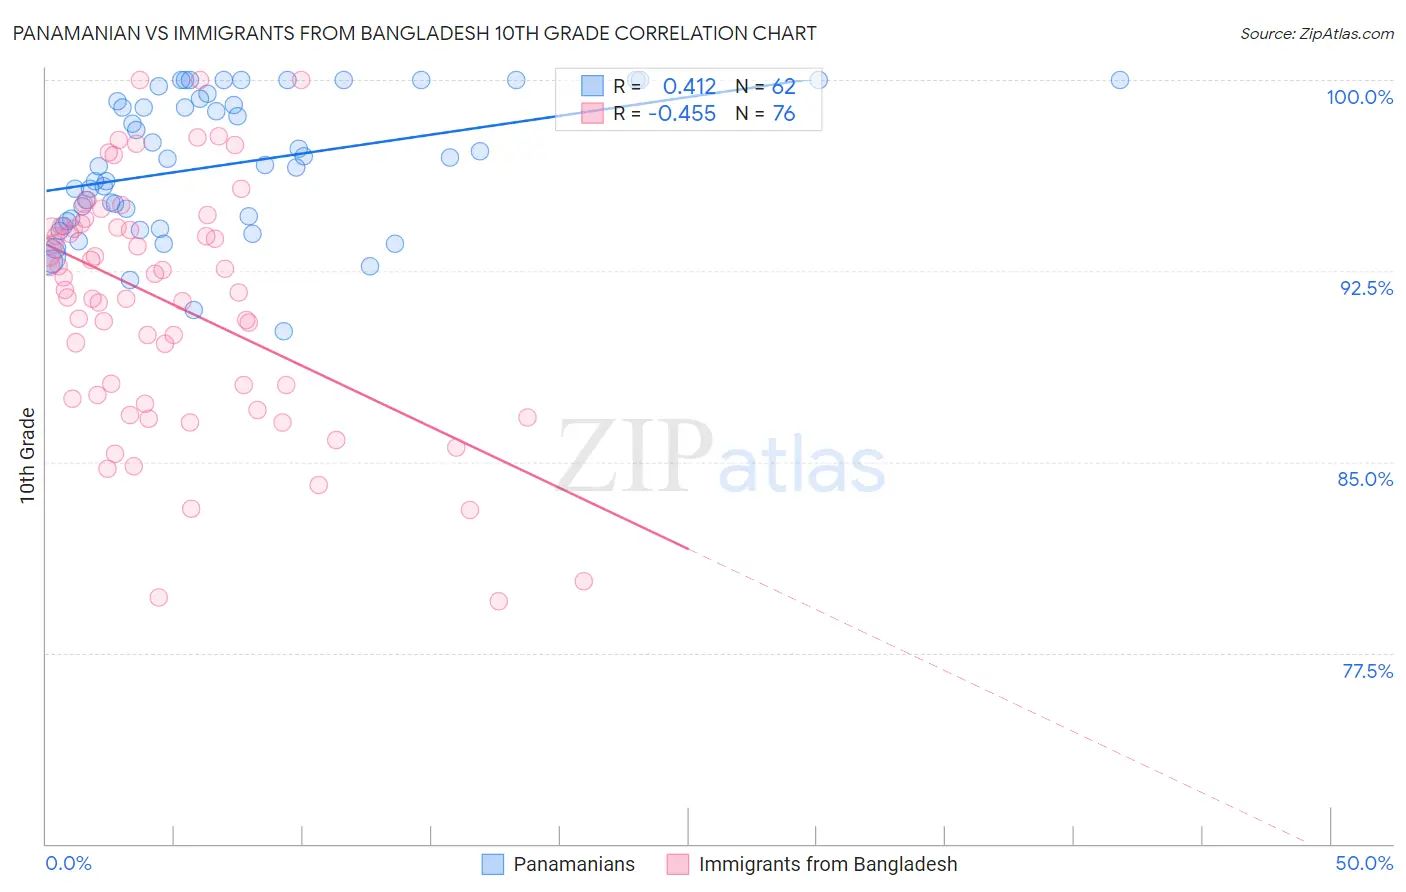
Panamanian vs Immigrants from Bangladesh 10th Grade Correlation Chart
The statistical analysis conducted on geographies consisting of 281,248,945 people shows a moderate positive correlation between the proportion of Panamanians and percentage of population with at least 10th grade education in the United States with a correlation coefficient (R) of 0.412 and weighted average of 93.5%. Similarly, the statistical analysis conducted on geographies consisting of 203,672,706 people shows a moderate negative correlation between the proportion of Immigrants from Bangladesh and percentage of population with at least 10th grade education in the United States with a correlation coefficient (R) of -0.455 and weighted average of 91.0%, a difference of 2.8%.
10th Grade Correlation Summary
| Measurement | Panamanian | Immigrants from Bangladesh |
| Minimum | 90.1% | 79.5% |
| Maximum | 100.0% | 100.0% |
| Range | 9.9% | 20.5% |
| Mean | 96.7% | 91.2% |
| Median | 96.8% | 92.0% |
| Interquartile 25% (IQ1) | 94.5% | 87.6% |
| Interquartile 75% (IQ3) | 99.2% | 94.2% |
| Interquartile Range (IQR) | 4.8% | 6.7% |
| Standard Deviation (Sample) | 2.7% | 4.7% |
| Standard Deviation (Population) | 2.7% | 4.7% |
Similar Demographics by 10th Grade
Demographics Similar to Panamanians by 10th Grade
In terms of 10th grade, the demographic groups most similar to Panamanians are Immigrants from Malaysia (93.5%, a difference of 0.0%), Immigrants from Morocco (93.5%, a difference of 0.010%), Cheyenne (93.5%, a difference of 0.010%), Yup'ik (93.6%, a difference of 0.030%), and Moroccan (93.5%, a difference of 0.030%).
| Demographics | Rating | Rank | 10th Grade |
| Immigrants | Eastern Asia | 35.1 /100 | #186 | Fair 93.6% |
| Liberians | 34.7 /100 | #187 | Fair 93.6% |
| Marshallese | 33.2 /100 | #188 | Fair 93.6% |
| Immigrants | Pakistan | 32.5 /100 | #189 | Fair 93.6% |
| Laotians | 32.1 /100 | #190 | Fair 93.6% |
| Yup'ik | 31.1 /100 | #191 | Fair 93.6% |
| Immigrants | Malaysia | 28.0 /100 | #192 | Fair 93.5% |
| Panamanians | 28.0 /100 | #193 | Fair 93.5% |
| Immigrants | Morocco | 26.9 /100 | #194 | Fair 93.5% |
| Cheyenne | 26.8 /100 | #195 | Fair 93.5% |
| Moroccans | 25.3 /100 | #196 | Fair 93.5% |
| Pueblo | 23.9 /100 | #197 | Fair 93.5% |
| Immigrants | Micronesia | 23.2 /100 | #198 | Fair 93.5% |
| Asians | 23.0 /100 | #199 | Fair 93.5% |
| Hopi | 22.2 /100 | #200 | Fair 93.5% |
Demographics Similar to Immigrants from Bangladesh by 10th Grade
In terms of 10th grade, the demographic groups most similar to Immigrants from Bangladesh are Immigrants from Fiji (91.0%, a difference of 0.010%), Immigrants (91.0%, a difference of 0.040%), Yaqui (91.1%, a difference of 0.070%), Vietnamese (90.9%, a difference of 0.080%), and Immigrants from Cambodia (90.9%, a difference of 0.10%).
| Demographics | Rating | Rank | 10th Grade |
| Japanese | 0.0 /100 | #301 | Tragic 91.2% |
| Immigrants | Guyana | 0.0 /100 | #302 | Tragic 91.2% |
| Immigrants | Vietnam | 0.0 /100 | #303 | Tragic 91.2% |
| Pima | 0.0 /100 | #304 | Tragic 91.2% |
| Immigrants | Dominica | 0.0 /100 | #305 | Tragic 91.1% |
| Yaqui | 0.0 /100 | #306 | Tragic 91.1% |
| Immigrants | Fiji | 0.0 /100 | #307 | Tragic 91.0% |
| Immigrants | Bangladesh | 0.0 /100 | #308 | Tragic 91.0% |
| Immigrants | Immigrants | 0.0 /100 | #309 | Tragic 91.0% |
| Vietnamese | 0.0 /100 | #310 | Tragic 90.9% |
| Immigrants | Cambodia | 0.0 /100 | #311 | Tragic 90.9% |
| Immigrants | Portugal | 0.0 /100 | #312 | Tragic 90.8% |
| Cape Verdeans | 0.0 /100 | #313 | Tragic 90.8% |
| Nepalese | 0.0 /100 | #314 | Tragic 90.7% |
| Immigrants | Caribbean | 0.0 /100 | #315 | Tragic 90.6% |