Palestinian vs Immigrants from Iraq College, Under 1 year
COMPARE
Palestinian
Immigrants from Iraq
College, Under 1 year
College, Under 1 year Comparison
Palestinians
Immigrants from Iraq
67.9%
COLLEGE, UNDER 1 YEAR
96.9/ 100
METRIC RATING
102nd/ 347
METRIC RANK
66.3%
COLLEGE, UNDER 1 YEAR
77.1/ 100
METRIC RATING
150th/ 347
METRIC RANK
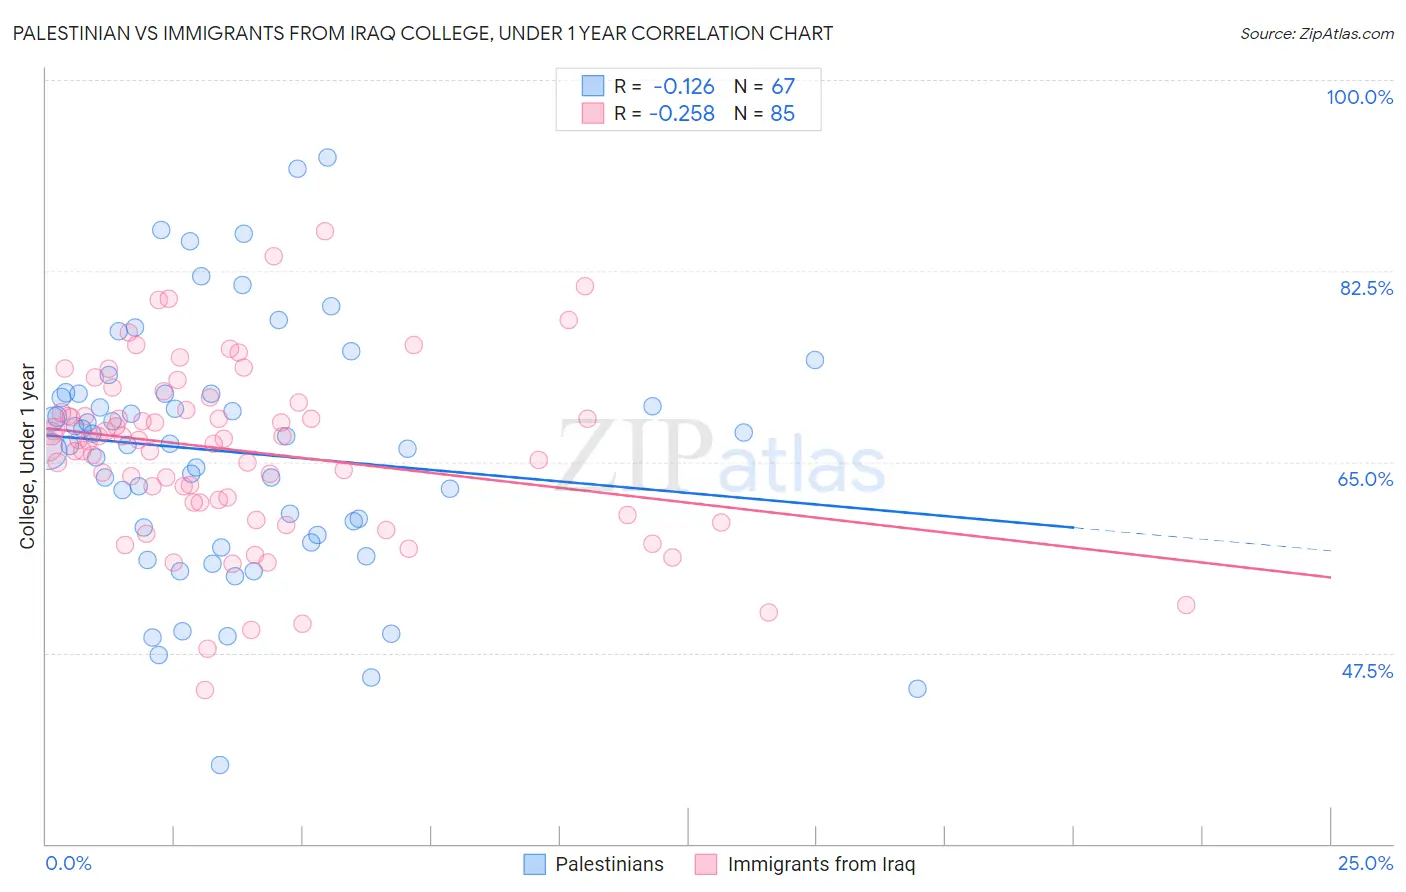
Palestinian vs Immigrants from Iraq College, Under 1 year Correlation Chart
The statistical analysis conducted on geographies consisting of 216,461,770 people shows a poor negative correlation between the proportion of Palestinians and percentage of population with at least college, under 1 year education in the United States with a correlation coefficient (R) of -0.126 and weighted average of 67.9%. Similarly, the statistical analysis conducted on geographies consisting of 194,780,026 people shows a weak negative correlation between the proportion of Immigrants from Iraq and percentage of population with at least college, under 1 year education in the United States with a correlation coefficient (R) of -0.258 and weighted average of 66.3%, a difference of 2.4%.
College, Under 1 year Correlation Summary
| Measurement | Palestinian | Immigrants from Iraq |
| Minimum | 37.3% | 44.1% |
| Maximum | 92.9% | 86.2% |
| Range | 55.6% | 42.1% |
| Mean | 65.9% | 66.0% |
| Median | 66.6% | 67.0% |
| Interquartile 25% (IQ1) | 58.3% | 61.3% |
| Interquartile 75% (IQ3) | 71.2% | 70.1% |
| Interquartile Range (IQR) | 12.9% | 8.8% |
| Standard Deviation (Sample) | 11.3% | 8.0% |
| Standard Deviation (Population) | 11.2% | 8.0% |
Similar Demographics by College, Under 1 year
Demographics Similar to Palestinians by College, Under 1 year
In terms of college, under 1 year, the demographic groups most similar to Palestinians are Immigrants from Eastern Europe (67.9%, a difference of 0.0%), Carpatho Rusyn (67.9%, a difference of 0.010%), Immigrants from Argentina (67.9%, a difference of 0.050%), Immigrants from Bolivia (67.9%, a difference of 0.060%), and Paraguayan (67.9%, a difference of 0.080%).
| Demographics | Rating | Rank | College, Under 1 year |
| Immigrants | Pakistan | 97.5 /100 | #95 | Exceptional 68.0% |
| Jordanians | 97.4 /100 | #96 | Exceptional 68.0% |
| Immigrants | Ethiopia | 97.3 /100 | #97 | Exceptional 68.0% |
| Paraguayans | 97.1 /100 | #98 | Exceptional 67.9% |
| Immigrants | Bolivia | 97.0 /100 | #99 | Exceptional 67.9% |
| Immigrants | Argentina | 97.0 /100 | #100 | Exceptional 67.9% |
| Immigrants | Eastern Europe | 96.9 /100 | #101 | Exceptional 67.9% |
| Palestinians | 96.9 /100 | #102 | Exceptional 67.9% |
| Carpatho Rusyns | 96.8 /100 | #103 | Exceptional 67.9% |
| Immigrants | Western Asia | 96.6 /100 | #104 | Exceptional 67.8% |
| Afghans | 96.6 /100 | #105 | Exceptional 67.8% |
| Immigrants | Croatia | 96.6 /100 | #106 | Exceptional 67.8% |
| Austrians | 96.4 /100 | #107 | Exceptional 67.8% |
| Immigrants | Egypt | 96.0 /100 | #108 | Exceptional 67.7% |
| Scandinavians | 95.8 /100 | #109 | Exceptional 67.7% |
Demographics Similar to Immigrants from Iraq by College, Under 1 year
In terms of college, under 1 year, the demographic groups most similar to Immigrants from Iraq are Immigrants from Venezuela (66.3%, a difference of 0.050%), Immigrants from Sudan (66.2%, a difference of 0.070%), Taiwanese (66.4%, a difference of 0.090%), Sudanese (66.2%, a difference of 0.18%), and Belgian (66.2%, a difference of 0.20%).
| Demographics | Rating | Rank | College, Under 1 year |
| Immigrants | Uganda | 82.8 /100 | #143 | Excellent 66.5% |
| Immigrants | Germany | 82.0 /100 | #144 | Excellent 66.5% |
| Immigrants | Kenya | 81.8 /100 | #145 | Excellent 66.5% |
| Kenyans | 81.7 /100 | #146 | Excellent 66.5% |
| Immigrants | Morocco | 81.7 /100 | #147 | Excellent 66.5% |
| Taiwanese | 78.6 /100 | #148 | Good 66.4% |
| Immigrants | Venezuela | 77.9 /100 | #149 | Good 66.3% |
| Immigrants | Iraq | 77.1 /100 | #150 | Good 66.3% |
| Immigrants | Sudan | 76.0 /100 | #151 | Good 66.2% |
| Sudanese | 74.1 /100 | #152 | Good 66.2% |
| Belgians | 73.7 /100 | #153 | Good 66.2% |
| Immigrants | Eritrea | 71.9 /100 | #154 | Good 66.1% |
| Irish | 70.3 /100 | #155 | Good 66.0% |
| Welsh | 69.9 /100 | #156 | Good 66.0% |
| Sierra Leoneans | 67.8 /100 | #157 | Good 66.0% |