Puerto Rican vs Immigrants from Iraq College, Under 1 year
COMPARE
Puerto Rican
Immigrants from Iraq
College, Under 1 year
College, Under 1 year Comparison
Puerto Ricans
Immigrants from Iraq
56.8%
COLLEGE, UNDER 1 YEAR
0.0/ 100
METRIC RATING
319th/ 347
METRIC RANK
66.3%
COLLEGE, UNDER 1 YEAR
77.1/ 100
METRIC RATING
150th/ 347
METRIC RANK
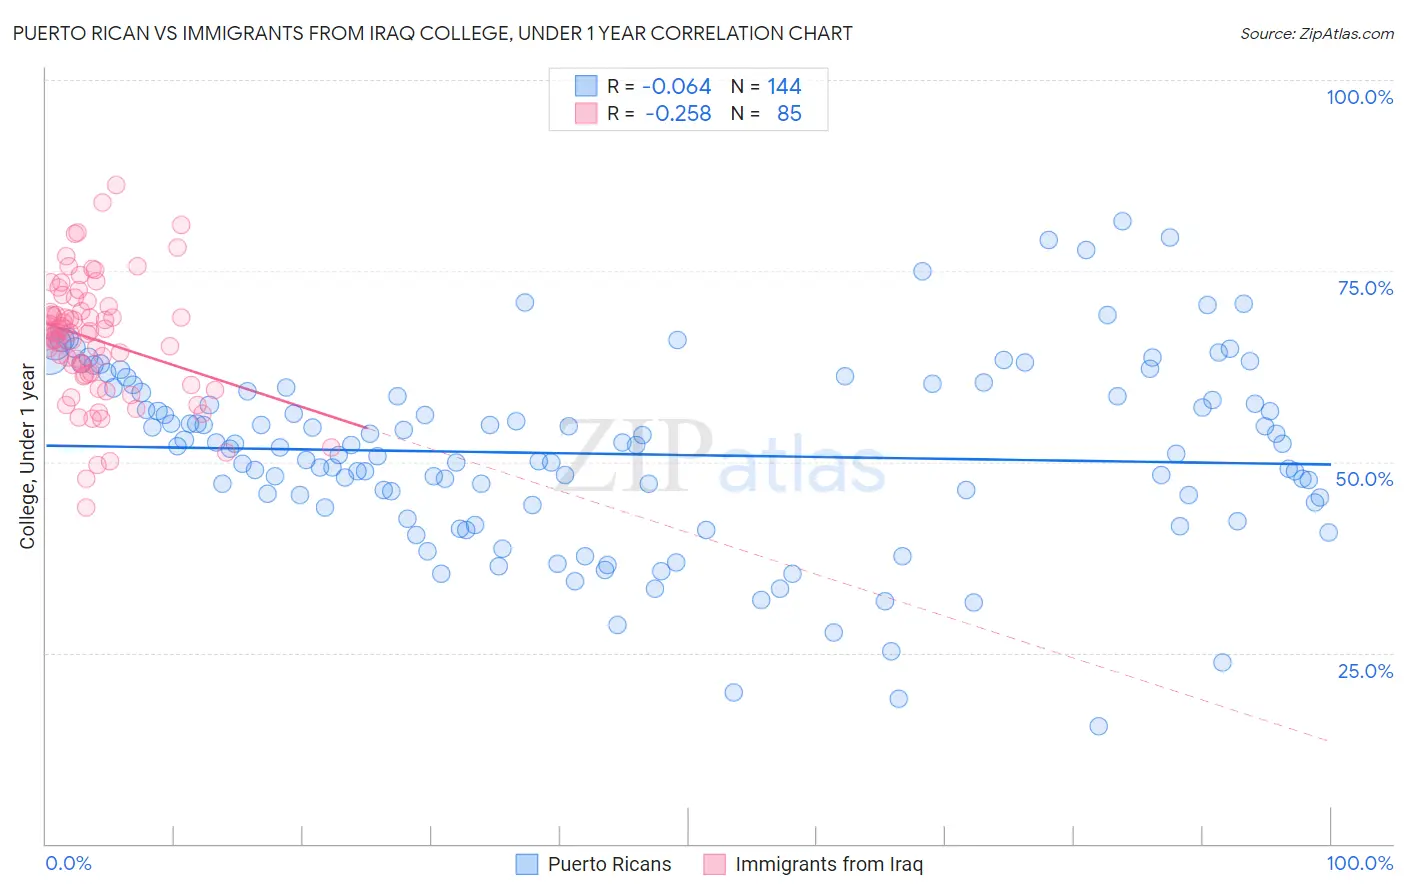
Puerto Rican vs Immigrants from Iraq College, Under 1 year Correlation Chart
The statistical analysis conducted on geographies consisting of 528,317,754 people shows a slight negative correlation between the proportion of Puerto Ricans and percentage of population with at least college, under 1 year education in the United States with a correlation coefficient (R) of -0.064 and weighted average of 56.8%. Similarly, the statistical analysis conducted on geographies consisting of 194,780,026 people shows a weak negative correlation between the proportion of Immigrants from Iraq and percentage of population with at least college, under 1 year education in the United States with a correlation coefficient (R) of -0.258 and weighted average of 66.3%, a difference of 16.7%.
College, Under 1 year Correlation Summary
| Measurement | Puerto Rican | Immigrants from Iraq |
| Minimum | 15.4% | 44.1% |
| Maximum | 81.5% | 86.2% |
| Range | 66.1% | 42.1% |
| Mean | 51.0% | 66.0% |
| Median | 52.0% | 67.0% |
| Interquartile 25% (IQ1) | 44.5% | 61.3% |
| Interquartile 75% (IQ3) | 59.2% | 70.1% |
| Interquartile Range (IQR) | 14.7% | 8.8% |
| Standard Deviation (Sample) | 12.2% | 8.0% |
| Standard Deviation (Population) | 12.2% | 8.0% |
Similar Demographics by College, Under 1 year
Demographics Similar to Puerto Ricans by College, Under 1 year
In terms of college, under 1 year, the demographic groups most similar to Puerto Ricans are Guatemalan (56.8%, a difference of 0.060%), Immigrants from Haiti (56.9%, a difference of 0.20%), Hispanic or Latino (57.0%, a difference of 0.32%), Native/Alaskan (56.6%, a difference of 0.32%), and Menominee (57.0%, a difference of 0.36%).
| Demographics | Rating | Rank | College, Under 1 year |
| Salvadorans | 0.0 /100 | #312 | Tragic 57.3% |
| Dutch West Indians | 0.0 /100 | #313 | Tragic 57.2% |
| Hopi | 0.0 /100 | #314 | Tragic 57.1% |
| Hondurans | 0.0 /100 | #315 | Tragic 57.1% |
| Menominee | 0.0 /100 | #316 | Tragic 57.0% |
| Hispanics or Latinos | 0.0 /100 | #317 | Tragic 57.0% |
| Immigrants | Haiti | 0.0 /100 | #318 | Tragic 56.9% |
| Puerto Ricans | 0.0 /100 | #319 | Tragic 56.8% |
| Guatemalans | 0.0 /100 | #320 | Tragic 56.8% |
| Natives/Alaskans | 0.0 /100 | #321 | Tragic 56.6% |
| Immigrants | Caribbean | 0.0 /100 | #322 | Tragic 56.6% |
| Immigrants | Honduras | 0.0 /100 | #323 | Tragic 56.5% |
| Immigrants | El Salvador | 0.0 /100 | #324 | Tragic 56.4% |
| Immigrants | Latin America | 0.0 /100 | #325 | Tragic 56.3% |
| Navajo | 0.0 /100 | #326 | Tragic 56.3% |
Demographics Similar to Immigrants from Iraq by College, Under 1 year
In terms of college, under 1 year, the demographic groups most similar to Immigrants from Iraq are Immigrants from Venezuela (66.3%, a difference of 0.050%), Immigrants from Sudan (66.2%, a difference of 0.070%), Taiwanese (66.4%, a difference of 0.090%), Sudanese (66.2%, a difference of 0.18%), and Belgian (66.2%, a difference of 0.20%).
| Demographics | Rating | Rank | College, Under 1 year |
| Immigrants | Uganda | 82.8 /100 | #143 | Excellent 66.5% |
| Immigrants | Germany | 82.0 /100 | #144 | Excellent 66.5% |
| Immigrants | Kenya | 81.8 /100 | #145 | Excellent 66.5% |
| Kenyans | 81.7 /100 | #146 | Excellent 66.5% |
| Immigrants | Morocco | 81.7 /100 | #147 | Excellent 66.5% |
| Taiwanese | 78.6 /100 | #148 | Good 66.4% |
| Immigrants | Venezuela | 77.9 /100 | #149 | Good 66.3% |
| Immigrants | Iraq | 77.1 /100 | #150 | Good 66.3% |
| Immigrants | Sudan | 76.0 /100 | #151 | Good 66.2% |
| Sudanese | 74.1 /100 | #152 | Good 66.2% |
| Belgians | 73.7 /100 | #153 | Good 66.2% |
| Immigrants | Eritrea | 71.9 /100 | #154 | Good 66.1% |
| Irish | 70.3 /100 | #155 | Good 66.0% |
| Welsh | 69.9 /100 | #156 | Good 66.0% |
| Sierra Leoneans | 67.8 /100 | #157 | Good 66.0% |