Palestinian vs British West Indian Unemployment Among Ages 35 to 44 years
COMPARE
Palestinian
British West Indian
Unemployment Among Ages 35 to 44 years
Unemployment Among Ages 35 to 44 years Comparison
Palestinians
British West Indians
4.3%
UNEMPLOYMENT AMONG AGES 35 TO 44 YEARS
98.8/ 100
METRIC RATING
39th/ 347
METRIC RANK
6.0%
UNEMPLOYMENT AMONG AGES 35 TO 44 YEARS
0.0/ 100
METRIC RATING
313th/ 347
METRIC RANK
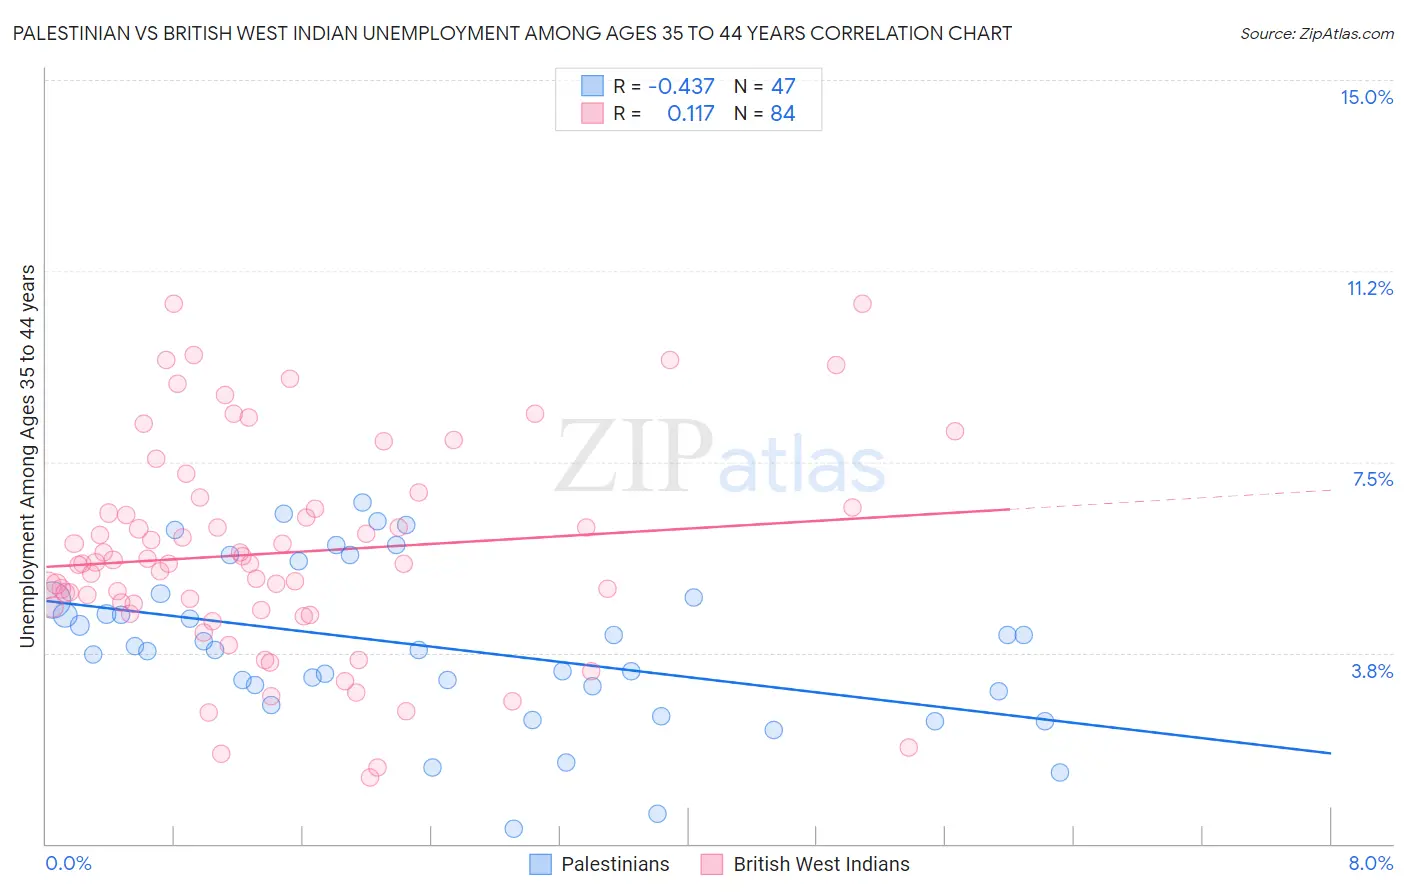
Palestinian vs British West Indian Unemployment Among Ages 35 to 44 years Correlation Chart
The statistical analysis conducted on geographies consisting of 214,645,990 people shows a moderate negative correlation between the proportion of Palestinians and unemployment rate among population between the ages 35 and 44 in the United States with a correlation coefficient (R) of -0.437 and weighted average of 4.3%. Similarly, the statistical analysis conducted on geographies consisting of 151,673,143 people shows a poor positive correlation between the proportion of British West Indians and unemployment rate among population between the ages 35 and 44 in the United States with a correlation coefficient (R) of 0.117 and weighted average of 6.0%, a difference of 38.3%.
Unemployment Among Ages 35 to 44 years Correlation Summary
| Measurement | Palestinian | British West Indian |
| Minimum | 0.30% | 1.3% |
| Maximum | 6.7% | 10.6% |
| Range | 6.4% | 9.3% |
| Mean | 3.9% | 5.7% |
| Median | 3.8% | 5.5% |
| Interquartile 25% (IQ1) | 3.0% | 4.6% |
| Interquartile 75% (IQ3) | 4.8% | 6.6% |
| Interquartile Range (IQR) | 1.8% | 2.0% |
| Standard Deviation (Sample) | 1.5% | 2.1% |
| Standard Deviation (Population) | 1.5% | 2.1% |
Similar Demographics by Unemployment Among Ages 35 to 44 years
Demographics Similar to Palestinians by Unemployment Among Ages 35 to 44 years
In terms of unemployment among ages 35 to 44 years, the demographic groups most similar to Palestinians are Burmese (4.3%, a difference of 0.060%), Zimbabwean (4.3%, a difference of 0.060%), Immigrants from Zimbabwe (4.3%, a difference of 0.13%), Belgian (4.3%, a difference of 0.16%), and Mongolian (4.3%, a difference of 0.17%).
| Demographics | Rating | Rank | Unemployment Among Ages 35 to 44 years |
| Chinese | 99.1 /100 | #32 | Exceptional 4.3% |
| Immigrants | Sri Lanka | 99.1 /100 | #33 | Exceptional 4.3% |
| Jordanians | 99.0 /100 | #34 | Exceptional 4.3% |
| Luxembourgers | 99.0 /100 | #35 | Exceptional 4.3% |
| Mongolians | 98.9 /100 | #36 | Exceptional 4.3% |
| Immigrants | Zimbabwe | 98.9 /100 | #37 | Exceptional 4.3% |
| Burmese | 98.9 /100 | #38 | Exceptional 4.3% |
| Palestinians | 98.8 /100 | #39 | Exceptional 4.3% |
| Zimbabweans | 98.8 /100 | #40 | Exceptional 4.3% |
| Belgians | 98.7 /100 | #41 | Exceptional 4.3% |
| Germans | 98.7 /100 | #42 | Exceptional 4.3% |
| Eastern Europeans | 98.7 /100 | #43 | Exceptional 4.3% |
| Immigrants | Malaysia | 98.7 /100 | #44 | Exceptional 4.3% |
| Immigrants | Korea | 98.4 /100 | #45 | Exceptional 4.3% |
| Immigrants | Belgium | 98.4 /100 | #46 | Exceptional 4.3% |
Demographics Similar to British West Indians by Unemployment Among Ages 35 to 44 years
In terms of unemployment among ages 35 to 44 years, the demographic groups most similar to British West Indians are Immigrants from Guyana (6.0%, a difference of 0.12%), Immigrants from Dominica (6.0%, a difference of 0.37%), Marshallese (5.9%, a difference of 1.2%), Guyanese (5.9%, a difference of 1.5%), and Black/African American (6.1%, a difference of 2.2%).
| Demographics | Rating | Rank | Unemployment Among Ages 35 to 44 years |
| Barbadians | 0.0 /100 | #306 | Tragic 5.7% |
| Immigrants | Belize | 0.0 /100 | #307 | Tragic 5.8% |
| Immigrants | Azores | 0.0 /100 | #308 | Tragic 5.8% |
| Immigrants | Barbados | 0.0 /100 | #309 | Tragic 5.8% |
| Guyanese | 0.0 /100 | #310 | Tragic 5.9% |
| Marshallese | 0.0 /100 | #311 | Tragic 5.9% |
| Immigrants | Guyana | 0.0 /100 | #312 | Tragic 6.0% |
| British West Indians | 0.0 /100 | #313 | Tragic 6.0% |
| Immigrants | Dominica | 0.0 /100 | #314 | Tragic 6.0% |
| Blacks/African Americans | 0.0 /100 | #315 | Tragic 6.1% |
| Tsimshian | 0.0 /100 | #316 | Tragic 6.2% |
| Immigrants | St. Vincent and the Grenadines | 0.0 /100 | #317 | Tragic 6.2% |
| Colville | 0.0 /100 | #318 | Tragic 6.2% |
| Immigrants | Grenada | 0.0 /100 | #319 | Tragic 6.2% |
| Immigrants | Armenia | 0.0 /100 | #320 | Tragic 6.2% |