Pakistani vs Apache Professional Degree
COMPARE
Pakistani
Apache
Professional Degree
Professional Degree Comparison
Pakistanis
Apache
4.8%
PROFESSIONAL DEGREE
90.9/ 100
METRIC RATING
132nd/ 347
METRIC RANK
3.5%
PROFESSIONAL DEGREE
0.5/ 100
METRIC RATING
281st/ 347
METRIC RANK
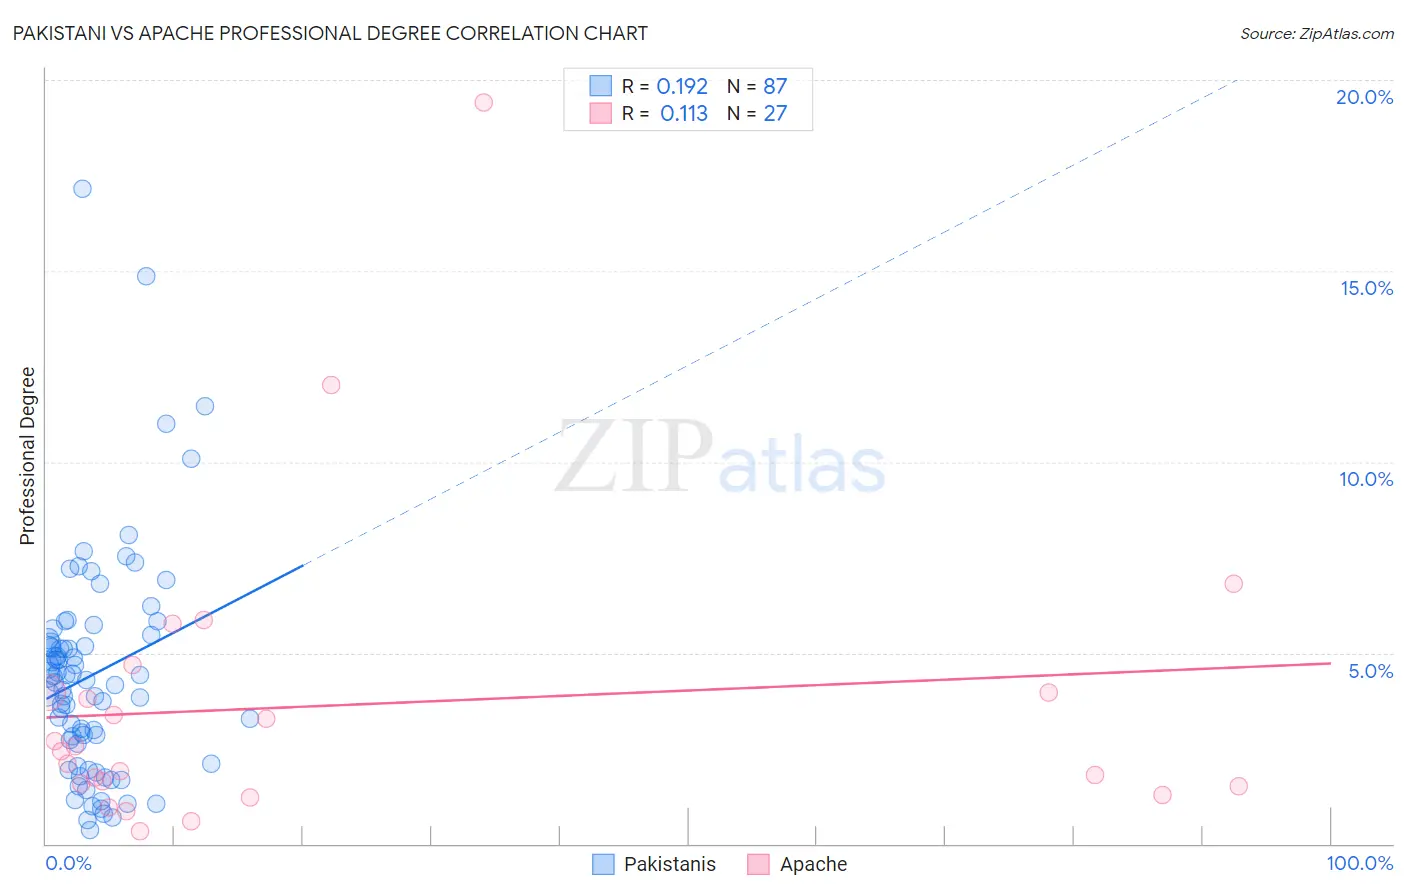
Pakistani vs Apache Professional Degree Correlation Chart
The statistical analysis conducted on geographies consisting of 334,796,739 people shows a poor positive correlation between the proportion of Pakistanis and percentage of population with at least professional degree education in the United States with a correlation coefficient (R) of 0.192 and weighted average of 4.8%. Similarly, the statistical analysis conducted on geographies consisting of 230,302,236 people shows a poor positive correlation between the proportion of Apache and percentage of population with at least professional degree education in the United States with a correlation coefficient (R) of 0.113 and weighted average of 3.5%, a difference of 34.7%.
Professional Degree Correlation Summary
| Measurement | Pakistani | Apache |
| Minimum | 0.37% | 0.33% |
| Maximum | 17.1% | 19.4% |
| Range | 16.8% | 19.1% |
| Mean | 4.4% | 3.6% |
| Median | 4.3% | 2.4% |
| Interquartile 25% (IQ1) | 2.6% | 1.5% |
| Interquartile 75% (IQ3) | 5.4% | 4.0% |
| Interquartile Range (IQR) | 2.8% | 2.5% |
| Standard Deviation (Sample) | 2.9% | 4.0% |
| Standard Deviation (Population) | 2.9% | 3.9% |
Similar Demographics by Professional Degree
Demographics Similar to Pakistanis by Professional Degree
In terms of professional degree, the demographic groups most similar to Pakistanis are Immigrants from Nepal (4.8%, a difference of 0.22%), Icelander (4.8%, a difference of 0.25%), Italian (4.8%, a difference of 0.25%), Palestinian (4.8%, a difference of 0.27%), and South American Indian (4.8%, a difference of 0.38%).
| Demographics | Rating | Rank | Professional Degree |
| Immigrants | Albania | 93.3 /100 | #125 | Exceptional 4.8% |
| Europeans | 93.2 /100 | #126 | Exceptional 4.8% |
| Serbians | 92.6 /100 | #127 | Exceptional 4.8% |
| Immigrants | Eastern Africa | 92.5 /100 | #128 | Exceptional 4.8% |
| Palestinians | 91.5 /100 | #129 | Exceptional 4.8% |
| Icelanders | 91.5 /100 | #130 | Exceptional 4.8% |
| Immigrants | Nepal | 91.4 /100 | #131 | Exceptional 4.8% |
| Pakistanis | 90.9 /100 | #132 | Exceptional 4.8% |
| Italians | 90.2 /100 | #133 | Exceptional 4.8% |
| South American Indians | 89.9 /100 | #134 | Excellent 4.8% |
| Macedonians | 89.8 /100 | #135 | Excellent 4.8% |
| Immigrants | Jordan | 89.0 /100 | #136 | Excellent 4.7% |
| Jordanians | 88.9 /100 | #137 | Excellent 4.7% |
| Afghans | 88.8 /100 | #138 | Excellent 4.7% |
| South Americans | 85.6 /100 | #139 | Excellent 4.7% |
Demographics Similar to Apache by Professional Degree
In terms of professional degree, the demographic groups most similar to Apache are Immigrants from Caribbean (3.5%, a difference of 0.020%), Dominican (3.5%, a difference of 0.030%), Immigrants from Portugal (3.5%, a difference of 0.060%), Japanese (3.5%, a difference of 0.10%), and Cheyenne (3.6%, a difference of 0.16%).
| Demographics | Rating | Rank | Professional Degree |
| Potawatomi | 0.5 /100 | #274 | Tragic 3.6% |
| Immigrants | Dominica | 0.5 /100 | #275 | Tragic 3.6% |
| Liberians | 0.5 /100 | #276 | Tragic 3.6% |
| Cheyenne | 0.5 /100 | #277 | Tragic 3.6% |
| Japanese | 0.5 /100 | #278 | Tragic 3.5% |
| Immigrants | Portugal | 0.5 /100 | #279 | Tragic 3.5% |
| Dominicans | 0.5 /100 | #280 | Tragic 3.5% |
| Apache | 0.5 /100 | #281 | Tragic 3.5% |
| Immigrants | Caribbean | 0.5 /100 | #282 | Tragic 3.5% |
| Comanche | 0.4 /100 | #283 | Tragic 3.5% |
| Salvadorans | 0.4 /100 | #284 | Tragic 3.5% |
| Hondurans | 0.3 /100 | #285 | Tragic 3.5% |
| Haitians | 0.3 /100 | #286 | Tragic 3.5% |
| Immigrants | El Salvador | 0.3 /100 | #287 | Tragic 3.5% |
| Blackfeet | 0.3 /100 | #288 | Tragic 3.5% |