Pakistani vs Immigrants from Japan Professional Degree
COMPARE
Pakistani
Immigrants from Japan
Professional Degree
Professional Degree Comparison
Pakistanis
Immigrants from Japan
4.8%
PROFESSIONAL DEGREE
90.9/ 100
METRIC RATING
132nd/ 347
METRIC RANK
6.4%
PROFESSIONAL DEGREE
100.0/ 100
METRIC RATING
22nd/ 347
METRIC RANK
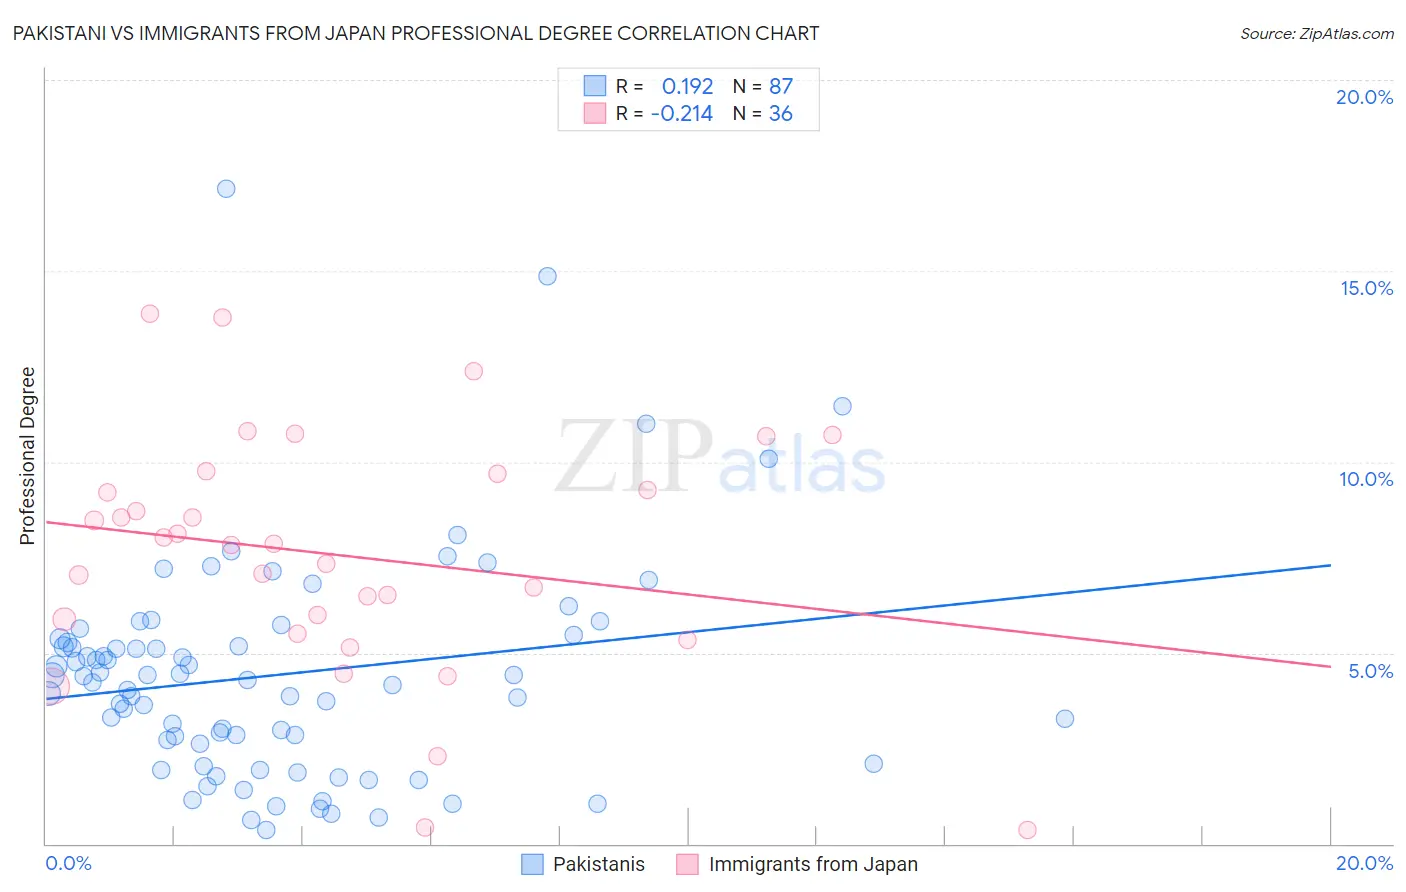
Pakistani vs Immigrants from Japan Professional Degree Correlation Chart
The statistical analysis conducted on geographies consisting of 334,796,739 people shows a poor positive correlation between the proportion of Pakistanis and percentage of population with at least professional degree education in the United States with a correlation coefficient (R) of 0.192 and weighted average of 4.8%. Similarly, the statistical analysis conducted on geographies consisting of 339,733,444 people shows a weak negative correlation between the proportion of Immigrants from Japan and percentage of population with at least professional degree education in the United States with a correlation coefficient (R) of -0.214 and weighted average of 6.4%, a difference of 33.3%.
Professional Degree Correlation Summary
| Measurement | Pakistani | Immigrants from Japan |
| Minimum | 0.37% | 0.36% |
| Maximum | 17.1% | 13.9% |
| Range | 16.8% | 13.5% |
| Mean | 4.4% | 7.6% |
| Median | 4.3% | 7.8% |
| Interquartile 25% (IQ1) | 2.6% | 5.7% |
| Interquartile 75% (IQ3) | 5.4% | 9.5% |
| Interquartile Range (IQR) | 2.8% | 3.8% |
| Standard Deviation (Sample) | 2.9% | 3.2% |
| Standard Deviation (Population) | 2.9% | 3.1% |
Similar Demographics by Professional Degree
Demographics Similar to Pakistanis by Professional Degree
In terms of professional degree, the demographic groups most similar to Pakistanis are Immigrants from Nepal (4.8%, a difference of 0.22%), Icelander (4.8%, a difference of 0.25%), Italian (4.8%, a difference of 0.25%), Palestinian (4.8%, a difference of 0.27%), and South American Indian (4.8%, a difference of 0.38%).
| Demographics | Rating | Rank | Professional Degree |
| Immigrants | Albania | 93.3 /100 | #125 | Exceptional 4.8% |
| Europeans | 93.2 /100 | #126 | Exceptional 4.8% |
| Serbians | 92.6 /100 | #127 | Exceptional 4.8% |
| Immigrants | Eastern Africa | 92.5 /100 | #128 | Exceptional 4.8% |
| Palestinians | 91.5 /100 | #129 | Exceptional 4.8% |
| Icelanders | 91.5 /100 | #130 | Exceptional 4.8% |
| Immigrants | Nepal | 91.4 /100 | #131 | Exceptional 4.8% |
| Pakistanis | 90.9 /100 | #132 | Exceptional 4.8% |
| Italians | 90.2 /100 | #133 | Exceptional 4.8% |
| South American Indians | 89.9 /100 | #134 | Excellent 4.8% |
| Macedonians | 89.8 /100 | #135 | Excellent 4.8% |
| Immigrants | Jordan | 89.0 /100 | #136 | Excellent 4.7% |
| Jordanians | 88.9 /100 | #137 | Excellent 4.7% |
| Afghans | 88.8 /100 | #138 | Excellent 4.7% |
| South Americans | 85.6 /100 | #139 | Excellent 4.7% |
Demographics Similar to Immigrants from Japan by Professional Degree
In terms of professional degree, the demographic groups most similar to Immigrants from Japan are Russian (6.3%, a difference of 0.48%), Immigrants from Spain (6.3%, a difference of 0.51%), Immigrants from Hong Kong (6.4%, a difference of 0.73%), Immigrants from Denmark (6.4%, a difference of 0.95%), and Immigrants from Ireland (6.3%, a difference of 1.0%).
| Demographics | Rating | Rank | Professional Degree |
| Immigrants | China | 100.0 /100 | #15 | Exceptional 6.7% |
| Immigrants | Sweden | 100.0 /100 | #16 | Exceptional 6.7% |
| Immigrants | Eastern Asia | 100.0 /100 | #17 | Exceptional 6.6% |
| Soviet Union | 100.0 /100 | #18 | Exceptional 6.6% |
| Indians (Asian) | 100.0 /100 | #19 | Exceptional 6.5% |
| Immigrants | Denmark | 100.0 /100 | #20 | Exceptional 6.4% |
| Immigrants | Hong Kong | 100.0 /100 | #21 | Exceptional 6.4% |
| Immigrants | Japan | 100.0 /100 | #22 | Exceptional 6.4% |
| Russians | 100.0 /100 | #23 | Exceptional 6.3% |
| Immigrants | Spain | 100.0 /100 | #24 | Exceptional 6.3% |
| Immigrants | Ireland | 100.0 /100 | #25 | Exceptional 6.3% |
| Latvians | 100.0 /100 | #26 | Exceptional 6.2% |
| Immigrants | Northern Europe | 100.0 /100 | #27 | Exceptional 6.2% |
| Turks | 100.0 /100 | #28 | Exceptional 6.2% |
| Immigrants | Sri Lanka | 100.0 /100 | #29 | Exceptional 6.2% |