Yakama vs Immigrants from Hong Kong Bachelor's Degree
COMPARE
Yakama
Immigrants from Hong Kong
Bachelor's Degree
Bachelor's Degree Comparison
Yakama
Immigrants from Hong Kong
24.5%
BACHELOR'S DEGREE
0.0/ 100
METRIC RATING
342nd/ 347
METRIC RANK
48.2%
BACHELOR'S DEGREE
100.0/ 100
METRIC RATING
14th/ 347
METRIC RANK
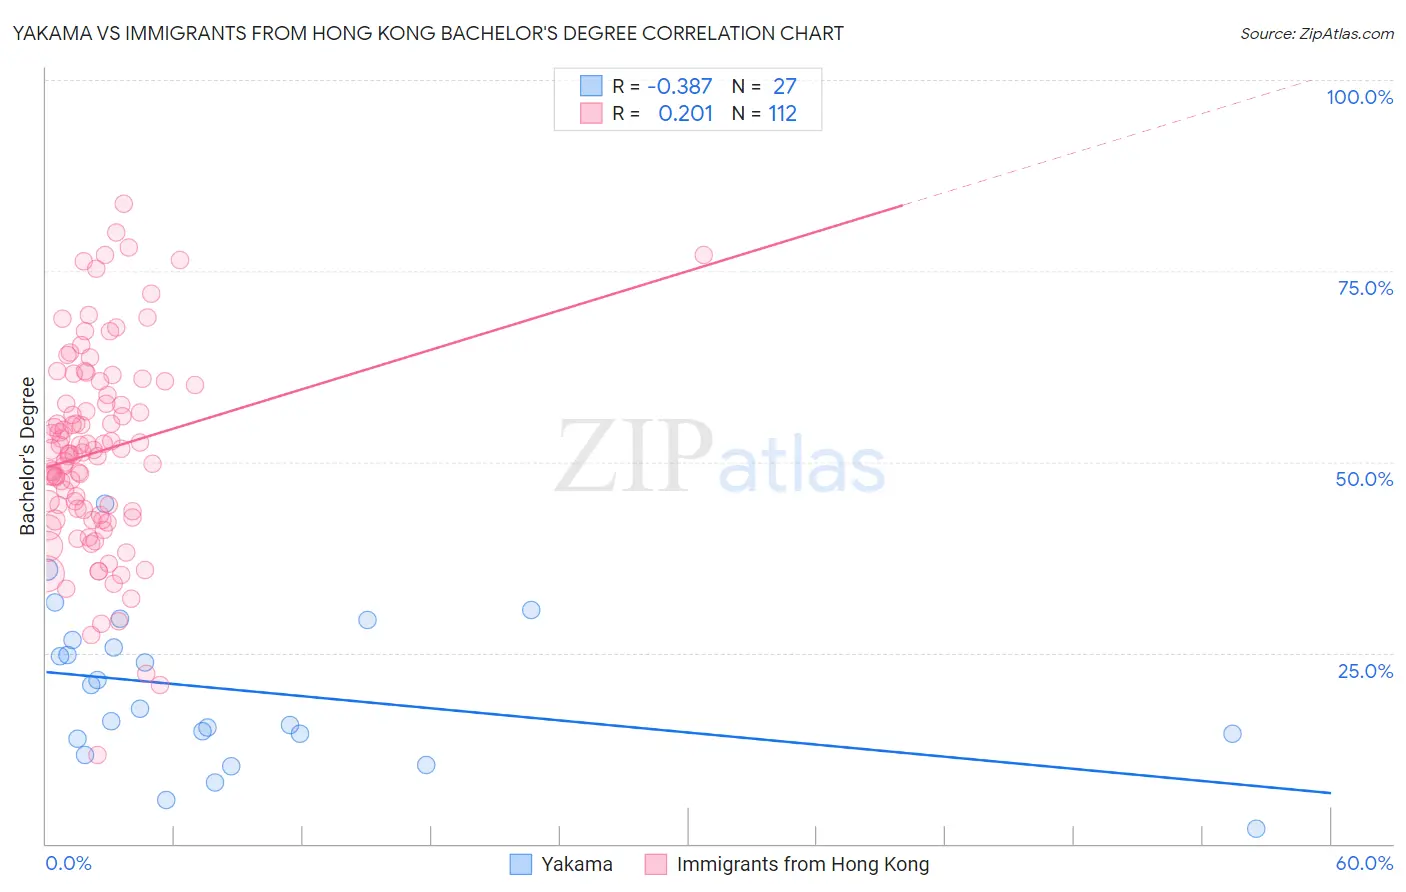
Yakama vs Immigrants from Hong Kong Bachelor's Degree Correlation Chart
The statistical analysis conducted on geographies consisting of 19,923,144 people shows a mild negative correlation between the proportion of Yakama and percentage of population with at least bachelor's degree education in the United States with a correlation coefficient (R) of -0.387 and weighted average of 24.5%. Similarly, the statistical analysis conducted on geographies consisting of 253,986,152 people shows a weak positive correlation between the proportion of Immigrants from Hong Kong and percentage of population with at least bachelor's degree education in the United States with a correlation coefficient (R) of 0.201 and weighted average of 48.2%, a difference of 97.1%.
Bachelor's Degree Correlation Summary
| Measurement | Yakama | Immigrants from Hong Kong |
| Minimum | 1.9% | 11.7% |
| Maximum | 44.4% | 83.9% |
| Range | 42.5% | 72.2% |
| Mean | 19.9% | 51.3% |
| Median | 17.6% | 51.2% |
| Interquartile 25% (IQ1) | 13.8% | 42.9% |
| Interquartile 75% (IQ3) | 26.6% | 59.4% |
| Interquartile Range (IQR) | 12.8% | 16.5% |
| Standard Deviation (Sample) | 9.9% | 13.2% |
| Standard Deviation (Population) | 9.7% | 13.1% |
Similar Demographics by Bachelor's Degree
Demographics Similar to Yakama by Bachelor's Degree
In terms of bachelor's degree, the demographic groups most similar to Yakama are Tohono O'odham (24.4%, a difference of 0.20%), Yuman (24.5%, a difference of 0.27%), Lumbee (24.8%, a difference of 1.2%), Hopi (25.3%, a difference of 3.4%), and Navajo (23.6%, a difference of 3.6%).
| Demographics | Rating | Rank | Bachelor's Degree |
| Mexicans | 0.0 /100 | #333 | Tragic 27.1% |
| Arapaho | 0.0 /100 | #334 | Tragic 26.6% |
| Natives/Alaskans | 0.0 /100 | #335 | Tragic 26.3% |
| Immigrants | Mexico | 0.0 /100 | #336 | Tragic 26.1% |
| Inupiat | 0.0 /100 | #337 | Tragic 25.8% |
| Pueblo | 0.0 /100 | #338 | Tragic 25.5% |
| Hopi | 0.0 /100 | #339 | Tragic 25.3% |
| Lumbee | 0.0 /100 | #340 | Tragic 24.8% |
| Yuman | 0.0 /100 | #341 | Tragic 24.5% |
| Yakama | 0.0 /100 | #342 | Tragic 24.5% |
| Tohono O'odham | 0.0 /100 | #343 | Tragic 24.4% |
| Navajo | 0.0 /100 | #344 | Tragic 23.6% |
| Pima | 0.0 /100 | #345 | Tragic 23.2% |
| Houma | 0.0 /100 | #346 | Tragic 21.4% |
| Yup'ik | 0.0 /100 | #347 | Tragic 19.4% |
Demographics Similar to Immigrants from Hong Kong by Bachelor's Degree
In terms of bachelor's degree, the demographic groups most similar to Immigrants from Hong Kong are Immigrants from Eastern Asia (48.1%, a difference of 0.14%), Immigrants from South Central Asia (48.3%, a difference of 0.28%), Immigrants from China (48.4%, a difference of 0.42%), Immigrants from Australia (48.5%, a difference of 0.60%), and Soviet Union (47.9%, a difference of 0.60%).
| Demographics | Rating | Rank | Bachelor's Degree |
| Immigrants | Iran | 100.0 /100 | #7 | Exceptional 50.3% |
| Thais | 100.0 /100 | #8 | Exceptional 50.1% |
| Immigrants | Israel | 100.0 /100 | #9 | Exceptional 50.0% |
| Cypriots | 100.0 /100 | #10 | Exceptional 49.0% |
| Immigrants | Australia | 100.0 /100 | #11 | Exceptional 48.5% |
| Immigrants | China | 100.0 /100 | #12 | Exceptional 48.4% |
| Immigrants | South Central Asia | 100.0 /100 | #13 | Exceptional 48.3% |
| Immigrants | Hong Kong | 100.0 /100 | #14 | Exceptional 48.2% |
| Immigrants | Eastern Asia | 100.0 /100 | #15 | Exceptional 48.1% |
| Soviet Union | 100.0 /100 | #16 | Exceptional 47.9% |
| Eastern Europeans | 100.0 /100 | #17 | Exceptional 47.5% |
| Indians (Asian) | 100.0 /100 | #18 | Exceptional 47.4% |
| Cambodians | 100.0 /100 | #19 | Exceptional 47.2% |
| Immigrants | Switzerland | 100.0 /100 | #20 | Exceptional 47.1% |
| Immigrants | Ireland | 100.0 /100 | #21 | Exceptional 47.1% |