Pakistani vs Palestinian 7th Grade
COMPARE
Pakistani
Palestinian
7th Grade
7th Grade Comparison
Pakistanis
Palestinians
96.0%
7TH GRADE
44.5/ 100
METRIC RATING
181st/ 347
METRIC RANK
96.4%
7TH GRADE
93.5/ 100
METRIC RATING
126th/ 347
METRIC RANK
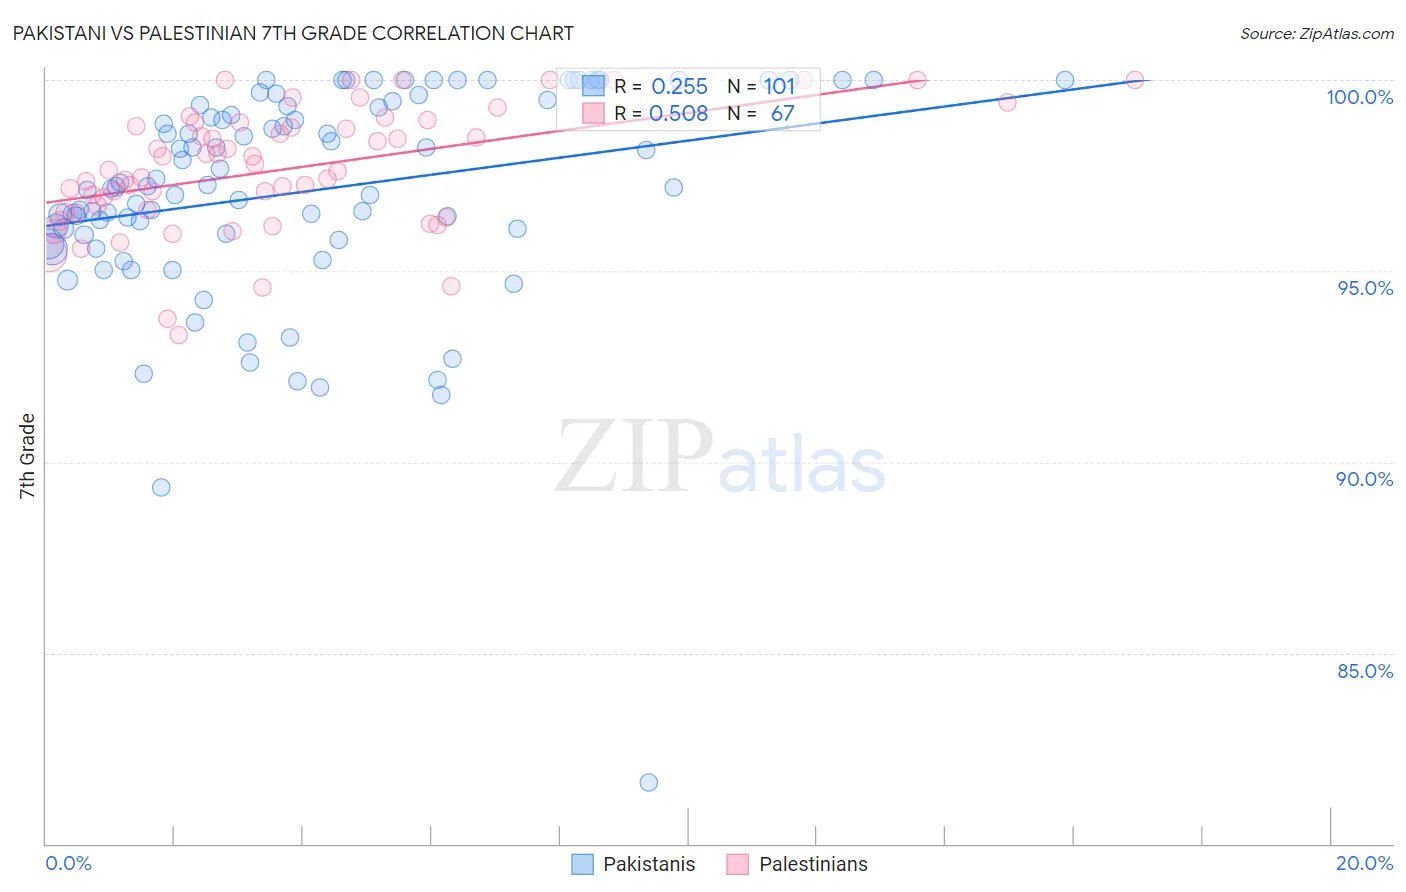
Pakistani vs Palestinian 7th Grade Correlation Chart
The statistical analysis conducted on geographies consisting of 335,355,370 people shows a weak positive correlation between the proportion of Pakistanis and percentage of population with at least 7th grade education in the United States with a correlation coefficient (R) of 0.255 and weighted average of 96.0%. Similarly, the statistical analysis conducted on geographies consisting of 216,424,519 people shows a substantial positive correlation between the proportion of Palestinians and percentage of population with at least 7th grade education in the United States with a correlation coefficient (R) of 0.508 and weighted average of 96.4%, a difference of 0.44%.
7th Grade Correlation Summary
| Measurement | Pakistani | Palestinian |
| Minimum | 81.6% | 93.3% |
| Maximum | 100.0% | 100.0% |
| Range | 18.4% | 6.7% |
| Mean | 97.1% | 97.7% |
| Median | 97.2% | 97.6% |
| Interquartile 25% (IQ1) | 96.0% | 96.5% |
| Interquartile 75% (IQ3) | 99.4% | 98.9% |
| Interquartile Range (IQR) | 3.4% | 2.4% |
| Standard Deviation (Sample) | 2.9% | 1.6% |
| Standard Deviation (Population) | 2.9% | 1.6% |
Similar Demographics by 7th Grade
Demographics Similar to Pakistanis by 7th Grade
In terms of 7th grade, the demographic groups most similar to Pakistanis are Immigrants from Brazil (96.0%, a difference of 0.010%), Marshallese (96.0%, a difference of 0.020%), Immigrants from Iran (96.0%, a difference of 0.020%), Iraqi (96.0%, a difference of 0.020%), and Mongolian (96.0%, a difference of 0.030%).
| Demographics | Rating | Rank | 7th Grade |
| Mongolians | 50.0 /100 | #174 | Average 96.0% |
| Blacks/African Americans | 49.5 /100 | #175 | Average 96.0% |
| Chileans | 49.3 /100 | #176 | Average 96.0% |
| Immigrants | Korea | 49.2 /100 | #177 | Average 96.0% |
| Marshallese | 48.4 /100 | #178 | Average 96.0% |
| Immigrants | Iran | 47.8 /100 | #179 | Average 96.0% |
| Immigrants | Brazil | 46.8 /100 | #180 | Average 96.0% |
| Pakistanis | 44.5 /100 | #181 | Average 96.0% |
| Iraqis | 41.2 /100 | #182 | Average 96.0% |
| Immigrants | Spain | 38.8 /100 | #183 | Fair 96.0% |
| Sierra Leoneans | 37.5 /100 | #184 | Fair 96.0% |
| Brazilians | 37.3 /100 | #185 | Fair 96.0% |
| Immigrants | Iraq | 36.1 /100 | #186 | Fair 96.0% |
| Immigrants | Uganda | 36.0 /100 | #187 | Fair 96.0% |
| Immigrants | Egypt | 34.3 /100 | #188 | Fair 95.9% |
Demographics Similar to Palestinians by 7th Grade
In terms of 7th grade, the demographic groups most similar to Palestinians are Immigrants from Bosnia and Herzegovina (96.4%, a difference of 0.0%), Immigrants from Bulgaria (96.4%, a difference of 0.010%), Immigrants from Romania (96.4%, a difference of 0.010%), Immigrants from North Macedonia (96.4%, a difference of 0.010%), and Immigrants from Serbia (96.4%, a difference of 0.020%).
| Demographics | Rating | Rank | 7th Grade |
| Immigrants | Norway | 95.2 /100 | #119 | Exceptional 96.5% |
| Immigrants | Croatia | 95.0 /100 | #120 | Exceptional 96.5% |
| Cheyenne | 94.9 /100 | #121 | Exceptional 96.5% |
| Immigrants | Europe | 94.8 /100 | #122 | Exceptional 96.5% |
| Immigrants | France | 94.7 /100 | #123 | Exceptional 96.5% |
| Immigrants | Switzerland | 94.5 /100 | #124 | Exceptional 96.5% |
| Immigrants | Bulgaria | 94.0 /100 | #125 | Exceptional 96.4% |
| Palestinians | 93.5 /100 | #126 | Exceptional 96.4% |
| Immigrants | Bosnia and Herzegovina | 93.3 /100 | #127 | Exceptional 96.4% |
| Immigrants | Romania | 93.2 /100 | #128 | Exceptional 96.4% |
| Immigrants | North Macedonia | 93.1 /100 | #129 | Exceptional 96.4% |
| Immigrants | Serbia | 92.8 /100 | #130 | Exceptional 96.4% |
| Filipinos | 92.1 /100 | #131 | Exceptional 96.4% |
| Colville | 91.7 /100 | #132 | Exceptional 96.4% |
| Hmong | 91.5 /100 | #133 | Exceptional 96.4% |