Pakistani vs Immigrants from Northern Africa 7th Grade
COMPARE
Pakistani
Immigrants from Northern Africa
7th Grade
7th Grade Comparison
Pakistanis
Immigrants from Northern Africa
96.0%
7TH GRADE
44.5/ 100
METRIC RATING
181st/ 347
METRIC RANK
95.8%
7TH GRADE
21.4/ 100
METRIC RATING
202nd/ 347
METRIC RANK
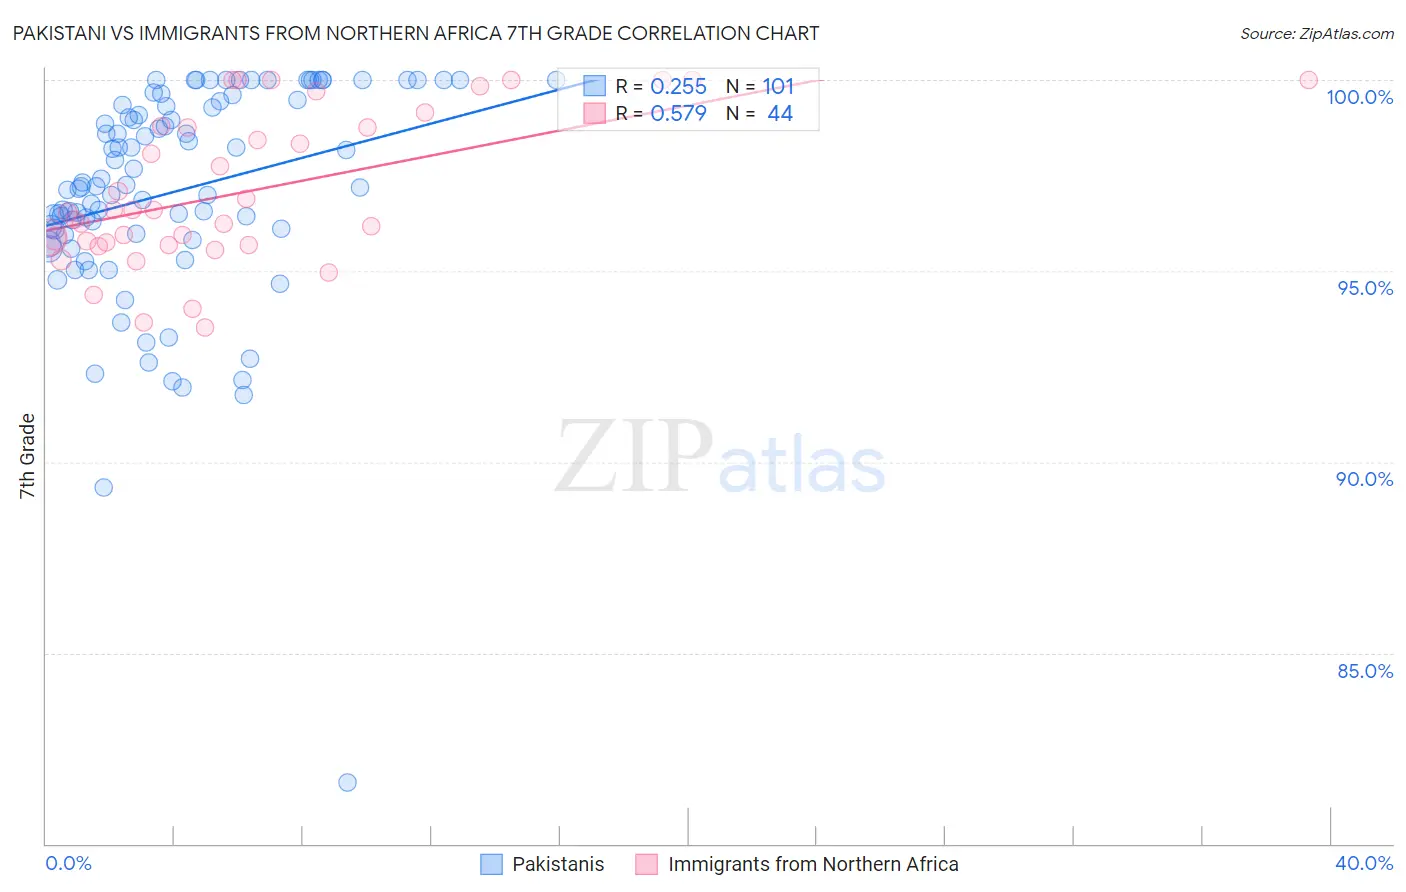
Pakistani vs Immigrants from Northern Africa 7th Grade Correlation Chart
The statistical analysis conducted on geographies consisting of 335,355,370 people shows a weak positive correlation between the proportion of Pakistanis and percentage of population with at least 7th grade education in the United States with a correlation coefficient (R) of 0.255 and weighted average of 96.0%. Similarly, the statistical analysis conducted on geographies consisting of 321,196,768 people shows a substantial positive correlation between the proportion of Immigrants from Northern Africa and percentage of population with at least 7th grade education in the United States with a correlation coefficient (R) of 0.579 and weighted average of 95.8%, a difference of 0.17%.
7th Grade Correlation Summary
| Measurement | Pakistani | Immigrants from Northern Africa |
| Minimum | 81.6% | 93.5% |
| Maximum | 100.0% | 100.0% |
| Range | 18.4% | 6.5% |
| Mean | 97.1% | 97.1% |
| Median | 97.2% | 96.6% |
| Interquartile 25% (IQ1) | 96.0% | 95.7% |
| Interquartile 75% (IQ3) | 99.4% | 98.8% |
| Interquartile Range (IQR) | 3.4% | 3.1% |
| Standard Deviation (Sample) | 2.9% | 2.0% |
| Standard Deviation (Population) | 2.9% | 1.9% |
Similar Demographics by 7th Grade
Demographics Similar to Pakistanis by 7th Grade
In terms of 7th grade, the demographic groups most similar to Pakistanis are Immigrants from Brazil (96.0%, a difference of 0.010%), Marshallese (96.0%, a difference of 0.020%), Immigrants from Iran (96.0%, a difference of 0.020%), Iraqi (96.0%, a difference of 0.020%), and Mongolian (96.0%, a difference of 0.030%).
| Demographics | Rating | Rank | 7th Grade |
| Mongolians | 50.0 /100 | #174 | Average 96.0% |
| Blacks/African Americans | 49.5 /100 | #175 | Average 96.0% |
| Chileans | 49.3 /100 | #176 | Average 96.0% |
| Immigrants | Korea | 49.2 /100 | #177 | Average 96.0% |
| Marshallese | 48.4 /100 | #178 | Average 96.0% |
| Immigrants | Iran | 47.8 /100 | #179 | Average 96.0% |
| Immigrants | Brazil | 46.8 /100 | #180 | Average 96.0% |
| Pakistanis | 44.5 /100 | #181 | Average 96.0% |
| Iraqis | 41.2 /100 | #182 | Average 96.0% |
| Immigrants | Spain | 38.8 /100 | #183 | Fair 96.0% |
| Sierra Leoneans | 37.5 /100 | #184 | Fair 96.0% |
| Brazilians | 37.3 /100 | #185 | Fair 96.0% |
| Immigrants | Iraq | 36.1 /100 | #186 | Fair 96.0% |
| Immigrants | Uganda | 36.0 /100 | #187 | Fair 96.0% |
| Immigrants | Egypt | 34.3 /100 | #188 | Fair 95.9% |
Demographics Similar to Immigrants from Northern Africa by 7th Grade
In terms of 7th grade, the demographic groups most similar to Immigrants from Northern Africa are Immigrants from Argentina (95.9%, a difference of 0.0%), Comanche (95.8%, a difference of 0.0%), Assyrian/Chaldean/Syriac (95.8%, a difference of 0.010%), Guamanian/Chamorro (95.9%, a difference of 0.020%), and Argentinean (95.9%, a difference of 0.020%).
| Demographics | Rating | Rank | 7th Grade |
| Sudanese | 28.1 /100 | #195 | Fair 95.9% |
| Apache | 27.6 /100 | #196 | Fair 95.9% |
| Immigrants | Zaire | 26.7 /100 | #197 | Fair 95.9% |
| Paraguayans | 24.8 /100 | #198 | Fair 95.9% |
| Guamanians/Chamorros | 23.5 /100 | #199 | Fair 95.9% |
| Argentineans | 23.2 /100 | #200 | Fair 95.9% |
| Immigrants | Argentina | 21.9 /100 | #201 | Fair 95.9% |
| Immigrants | Northern Africa | 21.4 /100 | #202 | Fair 95.8% |
| Comanche | 21.1 /100 | #203 | Fair 95.8% |
| Assyrians/Chaldeans/Syriacs | 20.5 /100 | #204 | Fair 95.8% |
| Moroccans | 18.9 /100 | #205 | Poor 95.8% |
| Africans | 17.6 /100 | #206 | Poor 95.8% |
| Navajo | 17.0 /100 | #207 | Poor 95.8% |
| Immigrants | Sudan | 17.0 /100 | #208 | Poor 95.8% |
| Dutch West Indians | 16.1 /100 | #209 | Poor 95.8% |