Pakistani vs Immigrants from Trinidad and Tobago 3rd Grade
COMPARE
Pakistani
Immigrants from Trinidad and Tobago
3rd Grade
3rd Grade Comparison
Pakistanis
Immigrants from Trinidad and Tobago
97.7%
3RD GRADE
34.2/ 100
METRIC RATING
189th/ 347
METRIC RANK
97.1%
3RD GRADE
0.0/ 100
METRIC RATING
284th/ 347
METRIC RANK
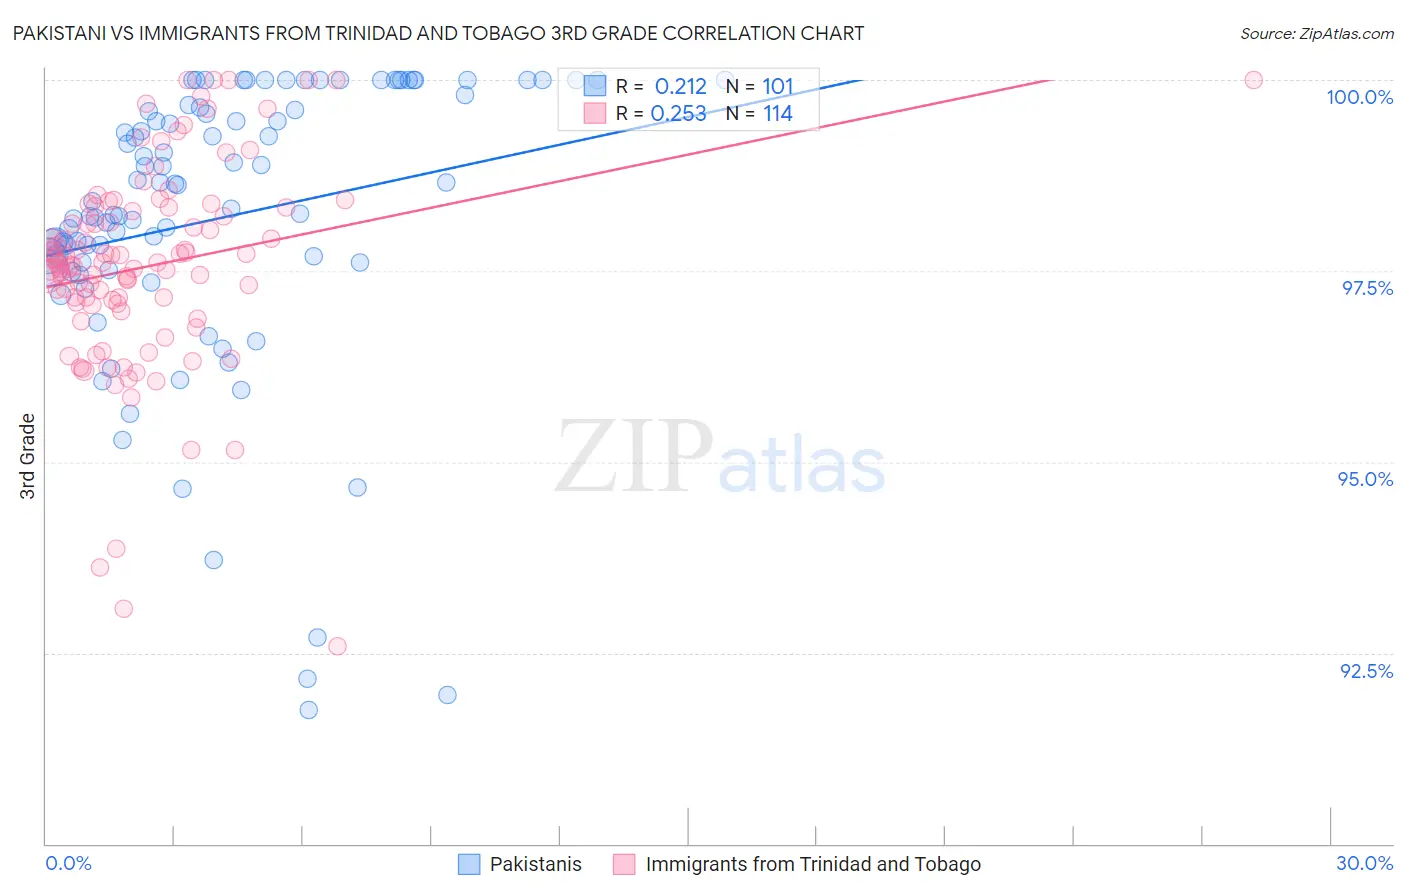
Pakistani vs Immigrants from Trinidad and Tobago 3rd Grade Correlation Chart
The statistical analysis conducted on geographies consisting of 335,355,370 people shows a weak positive correlation between the proportion of Pakistanis and percentage of population with at least 3rd grade education in the United States with a correlation coefficient (R) of 0.212 and weighted average of 97.7%. Similarly, the statistical analysis conducted on geographies consisting of 223,526,834 people shows a weak positive correlation between the proportion of Immigrants from Trinidad and Tobago and percentage of population with at least 3rd grade education in the United States with a correlation coefficient (R) of 0.253 and weighted average of 97.1%, a difference of 0.60%.
3rd Grade Correlation Summary
| Measurement | Pakistani | Immigrants from Trinidad and Tobago |
| Minimum | 91.8% | 92.6% |
| Maximum | 100.0% | 100.0% |
| Range | 8.2% | 7.4% |
| Mean | 98.2% | 97.6% |
| Median | 98.4% | 97.6% |
| Interquartile 25% (IQ1) | 97.6% | 97.1% |
| Interquartile 75% (IQ3) | 99.7% | 98.3% |
| Interquartile Range (IQR) | 2.1% | 1.3% |
| Standard Deviation (Sample) | 1.9% | 1.3% |
| Standard Deviation (Population) | 1.9% | 1.3% |
Similar Demographics by 3rd Grade
Demographics Similar to Pakistanis by 3rd Grade
In terms of 3rd grade, the demographic groups most similar to Pakistanis are Native/Alaskan (97.7%, a difference of 0.0%), Immigrants from Taiwan (97.7%, a difference of 0.0%), Immigrants from Kazakhstan (97.7%, a difference of 0.010%), Immigrants from Argentina (97.7%, a difference of 0.010%), and Portuguese (97.7%, a difference of 0.010%).
| Demographics | Rating | Rank | 3rd Grade |
| Argentineans | 42.9 /100 | #182 | Average 97.7% |
| Arabs | 40.0 /100 | #183 | Fair 97.7% |
| Immigrants | Kazakhstan | 37.4 /100 | #184 | Fair 97.7% |
| Immigrants | Argentina | 37.0 /100 | #185 | Fair 97.7% |
| Portuguese | 36.2 /100 | #186 | Fair 97.7% |
| Natives/Alaskans | 35.2 /100 | #187 | Fair 97.7% |
| Immigrants | Taiwan | 34.2 /100 | #188 | Fair 97.7% |
| Pakistanis | 34.2 /100 | #189 | Fair 97.7% |
| Panamanians | 31.5 /100 | #190 | Fair 97.7% |
| Blacks/African Americans | 29.6 /100 | #191 | Fair 97.7% |
| Mongolians | 29.1 /100 | #192 | Fair 97.7% |
| Immigrants | Kenya | 28.2 /100 | #193 | Fair 97.7% |
| Immigrants | Uganda | 27.4 /100 | #194 | Fair 97.7% |
| Immigrants | Egypt | 26.8 /100 | #195 | Fair 97.7% |
| Paraguayans | 26.2 /100 | #196 | Fair 97.7% |
Demographics Similar to Immigrants from Trinidad and Tobago by 3rd Grade
In terms of 3rd grade, the demographic groups most similar to Immigrants from Trinidad and Tobago are Afghan (97.1%, a difference of 0.020%), Houma (97.1%, a difference of 0.020%), Immigrants from Hong Kong (97.1%, a difference of 0.020%), Barbadian (97.2%, a difference of 0.030%), and Immigrants from Barbados (97.1%, a difference of 0.030%).
| Demographics | Rating | Rank | 3rd Grade |
| Trinidadians and Tobagonians | 0.1 /100 | #277 | Tragic 97.2% |
| Immigrants | Western Africa | 0.1 /100 | #278 | Tragic 97.2% |
| Immigrants | Philippines | 0.1 /100 | #279 | Tragic 97.2% |
| Immigrants | Ghana | 0.1 /100 | #280 | Tragic 97.2% |
| Barbadians | 0.1 /100 | #281 | Tragic 97.2% |
| Afghans | 0.1 /100 | #282 | Tragic 97.1% |
| Houma | 0.1 /100 | #283 | Tragic 97.1% |
| Immigrants | Trinidad and Tobago | 0.0 /100 | #284 | Tragic 97.1% |
| Immigrants | Hong Kong | 0.0 /100 | #285 | Tragic 97.1% |
| Immigrants | Barbados | 0.0 /100 | #286 | Tragic 97.1% |
| Immigrants | St. Vincent and the Grenadines | 0.0 /100 | #287 | Tragic 97.1% |
| Immigrants | West Indies | 0.0 /100 | #288 | Tragic 97.1% |
| Immigrants | Thailand | 0.0 /100 | #289 | Tragic 97.1% |
| Immigrants | Portugal | 0.0 /100 | #290 | Tragic 97.0% |
| Immigrants | Afghanistan | 0.0 /100 | #291 | Tragic 97.0% |