Pakistani vs Apache Unemployment Among Ages 45 to 54 years
COMPARE
Pakistani
Apache
Unemployment Among Ages 45 to 54 years
Unemployment Among Ages 45 to 54 years Comparison
Pakistanis
Apache
4.4%
UNEMPLOYMENT AMONG AGES 45 TO 54 YEARS
90.7/ 100
METRIC RATING
115th/ 347
METRIC RANK
7.0%
UNEMPLOYMENT AMONG AGES 45 TO 54 YEARS
0.0/ 100
METRIC RATING
337th/ 347
METRIC RANK
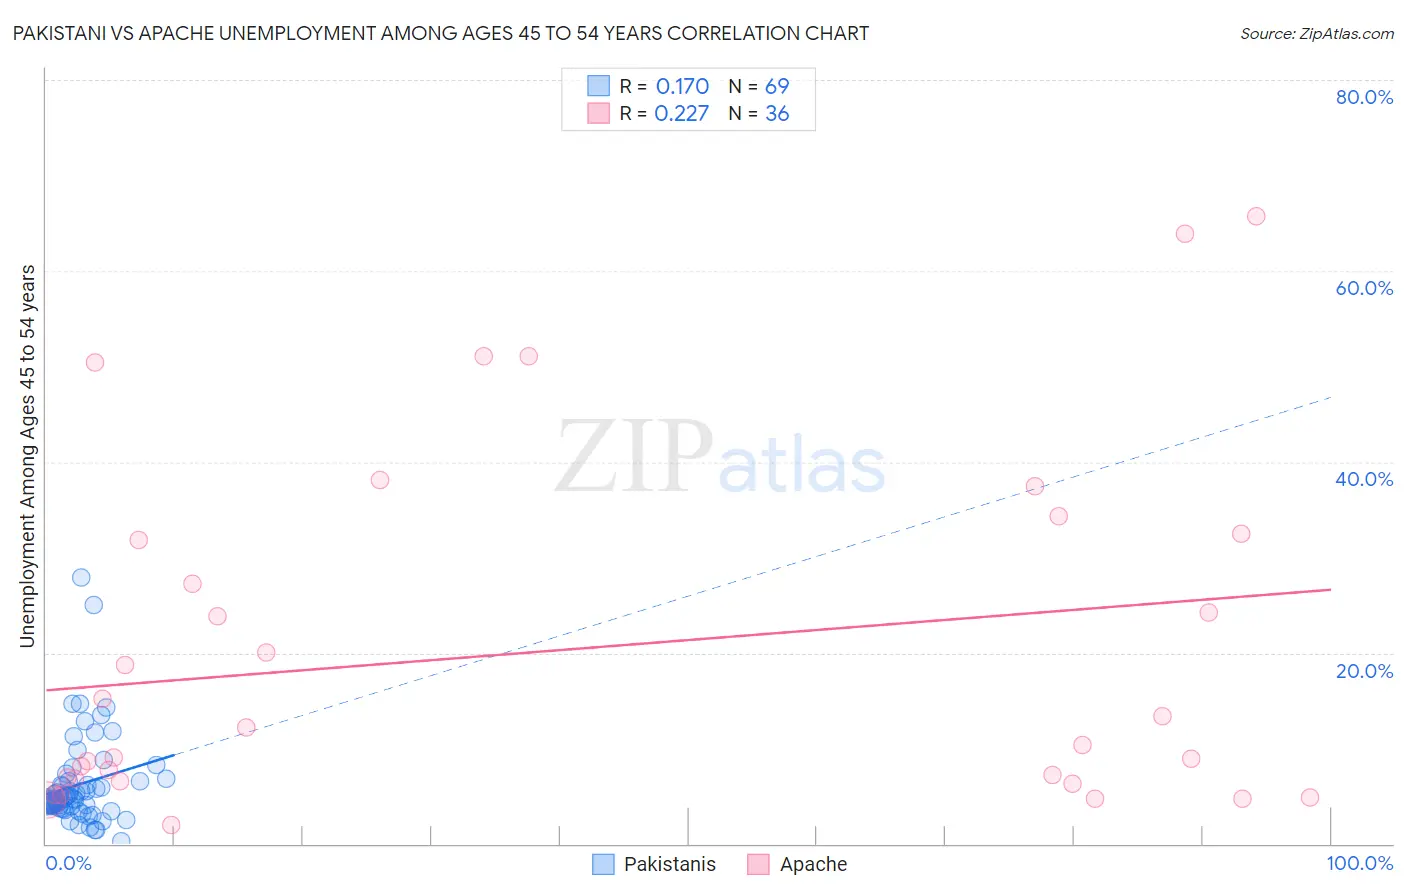
Pakistani vs Apache Unemployment Among Ages 45 to 54 years Correlation Chart
The statistical analysis conducted on geographies consisting of 329,355,930 people shows a poor positive correlation between the proportion of Pakistanis and unemployment rate among population between the ages 45 and 54 in the United States with a correlation coefficient (R) of 0.170 and weighted average of 4.4%. Similarly, the statistical analysis conducted on geographies consisting of 227,022,431 people shows a weak positive correlation between the proportion of Apache and unemployment rate among population between the ages 45 and 54 in the United States with a correlation coefficient (R) of 0.227 and weighted average of 7.0%, a difference of 59.6%.
Unemployment Among Ages 45 to 54 years Correlation Summary
| Measurement | Pakistani | Apache |
| Minimum | 0.30% | 1.9% |
| Maximum | 27.9% | 65.7% |
| Range | 27.6% | 63.8% |
| Mean | 6.2% | 20.2% |
| Median | 4.6% | 11.3% |
| Interquartile 25% (IQ1) | 3.9% | 6.7% |
| Interquartile 75% (IQ3) | 6.5% | 32.1% |
| Interquartile Range (IQR) | 2.7% | 25.4% |
| Standard Deviation (Sample) | 4.8% | 18.2% |
| Standard Deviation (Population) | 4.8% | 17.9% |
Similar Demographics by Unemployment Among Ages 45 to 54 years
Demographics Similar to Pakistanis by Unemployment Among Ages 45 to 54 years
In terms of unemployment among ages 45 to 54 years, the demographic groups most similar to Pakistanis are Immigrants from Chile (4.4%, a difference of 0.020%), Immigrants from North Macedonia (4.4%, a difference of 0.020%), French Canadian (4.4%, a difference of 0.040%), South African (4.4%, a difference of 0.040%), and Immigrants from Saudi Arabia (4.4%, a difference of 0.050%).
| Demographics | Rating | Rank | Unemployment Among Ages 45 to 54 years |
| Russians | 92.1 /100 | #108 | Exceptional 4.4% |
| New Zealanders | 91.9 /100 | #109 | Exceptional 4.4% |
| Immigrants | England | 91.3 /100 | #110 | Exceptional 4.4% |
| Immigrants | Nicaragua | 91.3 /100 | #111 | Exceptional 4.4% |
| Immigrants | Saudi Arabia | 91.1 /100 | #112 | Exceptional 4.4% |
| French Canadians | 91.0 /100 | #113 | Exceptional 4.4% |
| Immigrants | Chile | 90.9 /100 | #114 | Exceptional 4.4% |
| Pakistanis | 90.7 /100 | #115 | Exceptional 4.4% |
| Immigrants | North Macedonia | 90.6 /100 | #116 | Exceptional 4.4% |
| South Africans | 90.4 /100 | #117 | Exceptional 4.4% |
| Immigrants | Romania | 90.0 /100 | #118 | Exceptional 4.4% |
| Native Hawaiians | 90.0 /100 | #119 | Excellent 4.4% |
| Americans | 89.6 /100 | #120 | Excellent 4.4% |
| Immigrants | Oceania | 89.5 /100 | #121 | Excellent 4.4% |
| Immigrants | Kazakhstan | 89.5 /100 | #122 | Excellent 4.4% |
Demographics Similar to Apache by Unemployment Among Ages 45 to 54 years
In terms of unemployment among ages 45 to 54 years, the demographic groups most similar to Apache are Puerto Rican (6.8%, a difference of 3.4%), Colville (7.4%, a difference of 5.0%), Navajo (6.7%, a difference of 5.6%), Sioux (6.6%, a difference of 6.1%), and Arapaho (7.5%, a difference of 6.5%).
| Demographics | Rating | Rank | Unemployment Among Ages 45 to 54 years |
| Immigrants | Dominican Republic | 0.0 /100 | #330 | Tragic 6.3% |
| Tohono O'odham | 0.0 /100 | #331 | Tragic 6.3% |
| Pima | 0.0 /100 | #332 | Tragic 6.4% |
| Immigrants | Yemen | 0.0 /100 | #333 | Tragic 6.5% |
| Sioux | 0.0 /100 | #334 | Tragic 6.6% |
| Navajo | 0.0 /100 | #335 | Tragic 6.7% |
| Puerto Ricans | 0.0 /100 | #336 | Tragic 6.8% |
| Apache | 0.0 /100 | #337 | Tragic 7.0% |
| Colville | 0.0 /100 | #338 | Tragic 7.4% |
| Arapaho | 0.0 /100 | #339 | Tragic 7.5% |
| Hopi | 0.0 /100 | #340 | Tragic 7.5% |
| Paiute | 0.0 /100 | #341 | Tragic 7.8% |
| Alaskan Athabascans | 0.0 /100 | #342 | Tragic 8.5% |
| Inupiat | 0.0 /100 | #343 | Tragic 9.2% |
| Yuman | 0.0 /100 | #344 | Tragic 9.5% |