Immigrants from Eastern Africa vs Apache Professional Degree
COMPARE
Immigrants from Eastern Africa
Apache
Professional Degree
Professional Degree Comparison
Immigrants from Eastern Africa
Apache
4.8%
PROFESSIONAL DEGREE
92.5/ 100
METRIC RATING
128th/ 347
METRIC RANK
3.5%
PROFESSIONAL DEGREE
0.5/ 100
METRIC RATING
281st/ 347
METRIC RANK
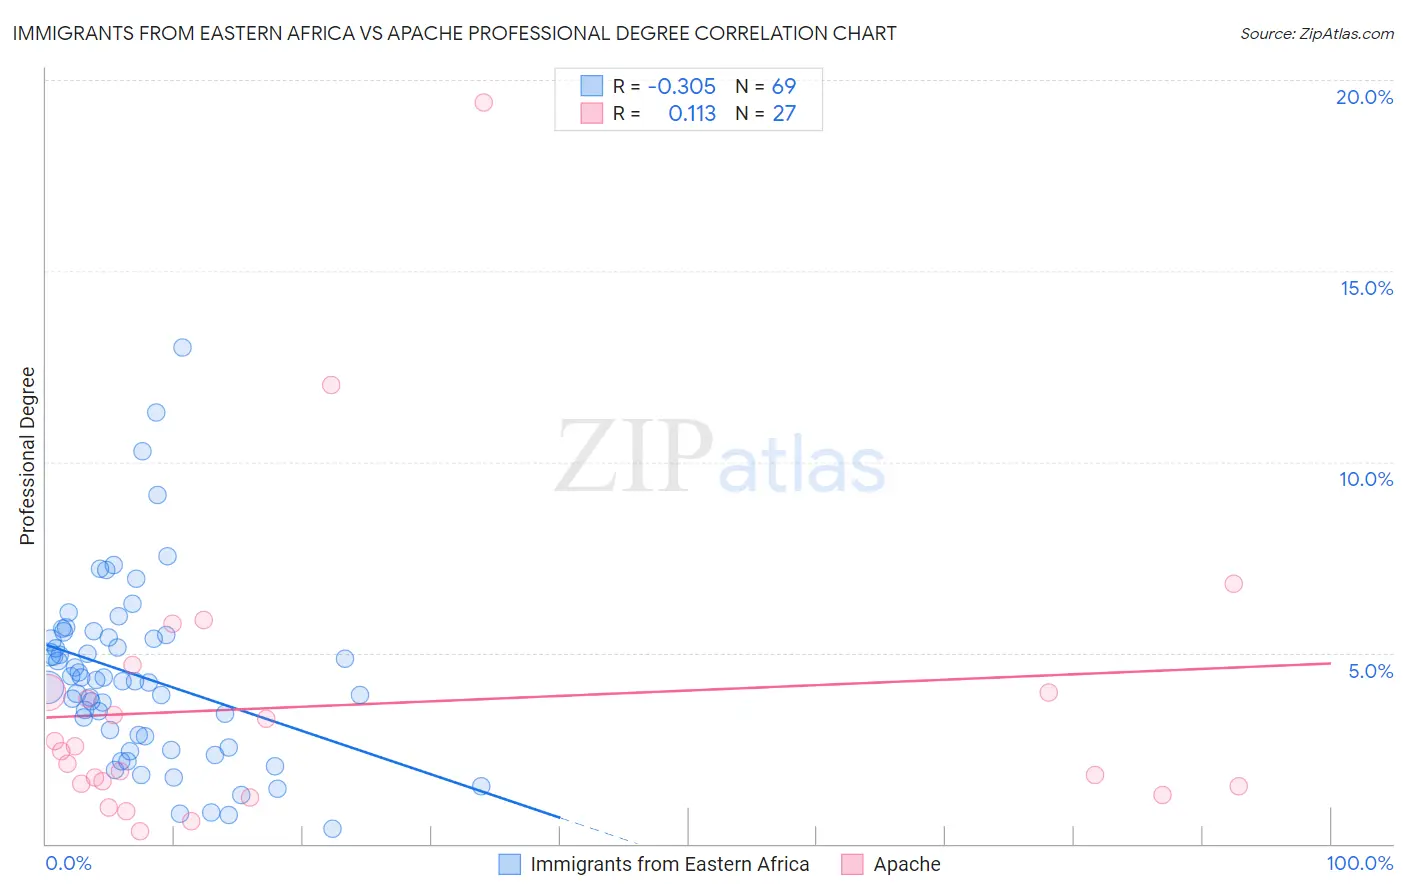
Immigrants from Eastern Africa vs Apache Professional Degree Correlation Chart
The statistical analysis conducted on geographies consisting of 354,533,484 people shows a mild negative correlation between the proportion of Immigrants from Eastern Africa and percentage of population with at least professional degree education in the United States with a correlation coefficient (R) of -0.305 and weighted average of 4.8%. Similarly, the statistical analysis conducted on geographies consisting of 230,302,236 people shows a poor positive correlation between the proportion of Apache and percentage of population with at least professional degree education in the United States with a correlation coefficient (R) of 0.113 and weighted average of 3.5%, a difference of 35.7%.
Professional Degree Correlation Summary
| Measurement | Immigrants from Eastern Africa | Apache |
| Minimum | 0.40% | 0.33% |
| Maximum | 13.0% | 19.4% |
| Range | 12.6% | 19.1% |
| Mean | 4.4% | 3.6% |
| Median | 4.3% | 2.4% |
| Interquartile 25% (IQ1) | 2.7% | 1.5% |
| Interquartile 75% (IQ3) | 5.4% | 4.0% |
| Interquartile Range (IQR) | 2.8% | 2.5% |
| Standard Deviation (Sample) | 2.4% | 4.0% |
| Standard Deviation (Population) | 2.4% | 3.9% |
Similar Demographics by Professional Degree
Demographics Similar to Immigrants from Eastern Africa by Professional Degree
In terms of professional degree, the demographic groups most similar to Immigrants from Eastern Africa are Serbian (4.8%, a difference of 0.020%), European (4.8%, a difference of 0.32%), Immigrants from Albania (4.8%, a difference of 0.37%), Palestinian (4.8%, a difference of 0.46%), and Icelander (4.8%, a difference of 0.48%).
| Demographics | Rating | Rank | Professional Degree |
| Immigrants | Moldova | 94.8 /100 | #121 | Exceptional 4.9% |
| Immigrants | Germany | 94.1 /100 | #122 | Exceptional 4.9% |
| Immigrants | Venezuela | 93.8 /100 | #123 | Exceptional 4.8% |
| Immigrants | Eritrea | 93.5 /100 | #124 | Exceptional 4.8% |
| Immigrants | Albania | 93.3 /100 | #125 | Exceptional 4.8% |
| Europeans | 93.2 /100 | #126 | Exceptional 4.8% |
| Serbians | 92.6 /100 | #127 | Exceptional 4.8% |
| Immigrants | Eastern Africa | 92.5 /100 | #128 | Exceptional 4.8% |
| Palestinians | 91.5 /100 | #129 | Exceptional 4.8% |
| Icelanders | 91.5 /100 | #130 | Exceptional 4.8% |
| Immigrants | Nepal | 91.4 /100 | #131 | Exceptional 4.8% |
| Pakistanis | 90.9 /100 | #132 | Exceptional 4.8% |
| Italians | 90.2 /100 | #133 | Exceptional 4.8% |
| South American Indians | 89.9 /100 | #134 | Excellent 4.8% |
| Macedonians | 89.8 /100 | #135 | Excellent 4.8% |
Demographics Similar to Apache by Professional Degree
In terms of professional degree, the demographic groups most similar to Apache are Immigrants from Caribbean (3.5%, a difference of 0.020%), Dominican (3.5%, a difference of 0.030%), Immigrants from Portugal (3.5%, a difference of 0.060%), Japanese (3.5%, a difference of 0.10%), and Cheyenne (3.6%, a difference of 0.16%).
| Demographics | Rating | Rank | Professional Degree |
| Potawatomi | 0.5 /100 | #274 | Tragic 3.6% |
| Immigrants | Dominica | 0.5 /100 | #275 | Tragic 3.6% |
| Liberians | 0.5 /100 | #276 | Tragic 3.6% |
| Cheyenne | 0.5 /100 | #277 | Tragic 3.6% |
| Japanese | 0.5 /100 | #278 | Tragic 3.5% |
| Immigrants | Portugal | 0.5 /100 | #279 | Tragic 3.5% |
| Dominicans | 0.5 /100 | #280 | Tragic 3.5% |
| Apache | 0.5 /100 | #281 | Tragic 3.5% |
| Immigrants | Caribbean | 0.5 /100 | #282 | Tragic 3.5% |
| Comanche | 0.4 /100 | #283 | Tragic 3.5% |
| Salvadorans | 0.4 /100 | #284 | Tragic 3.5% |
| Hondurans | 0.3 /100 | #285 | Tragic 3.5% |
| Haitians | 0.3 /100 | #286 | Tragic 3.5% |
| Immigrants | El Salvador | 0.3 /100 | #287 | Tragic 3.5% |
| Blackfeet | 0.3 /100 | #288 | Tragic 3.5% |