Immigrants from France vs West Indian 12th Grade, No Diploma
COMPARE
Immigrants from France
West Indian
12th Grade, No Diploma
12th Grade, No Diploma Comparison
Immigrants from France
West Indians
92.4%
12TH GRADE, NO DIPLOMA
98.8/ 100
METRIC RATING
87th/ 347
METRIC RANK
89.3%
12TH GRADE, NO DIPLOMA
0.2/ 100
METRIC RATING
267th/ 347
METRIC RANK
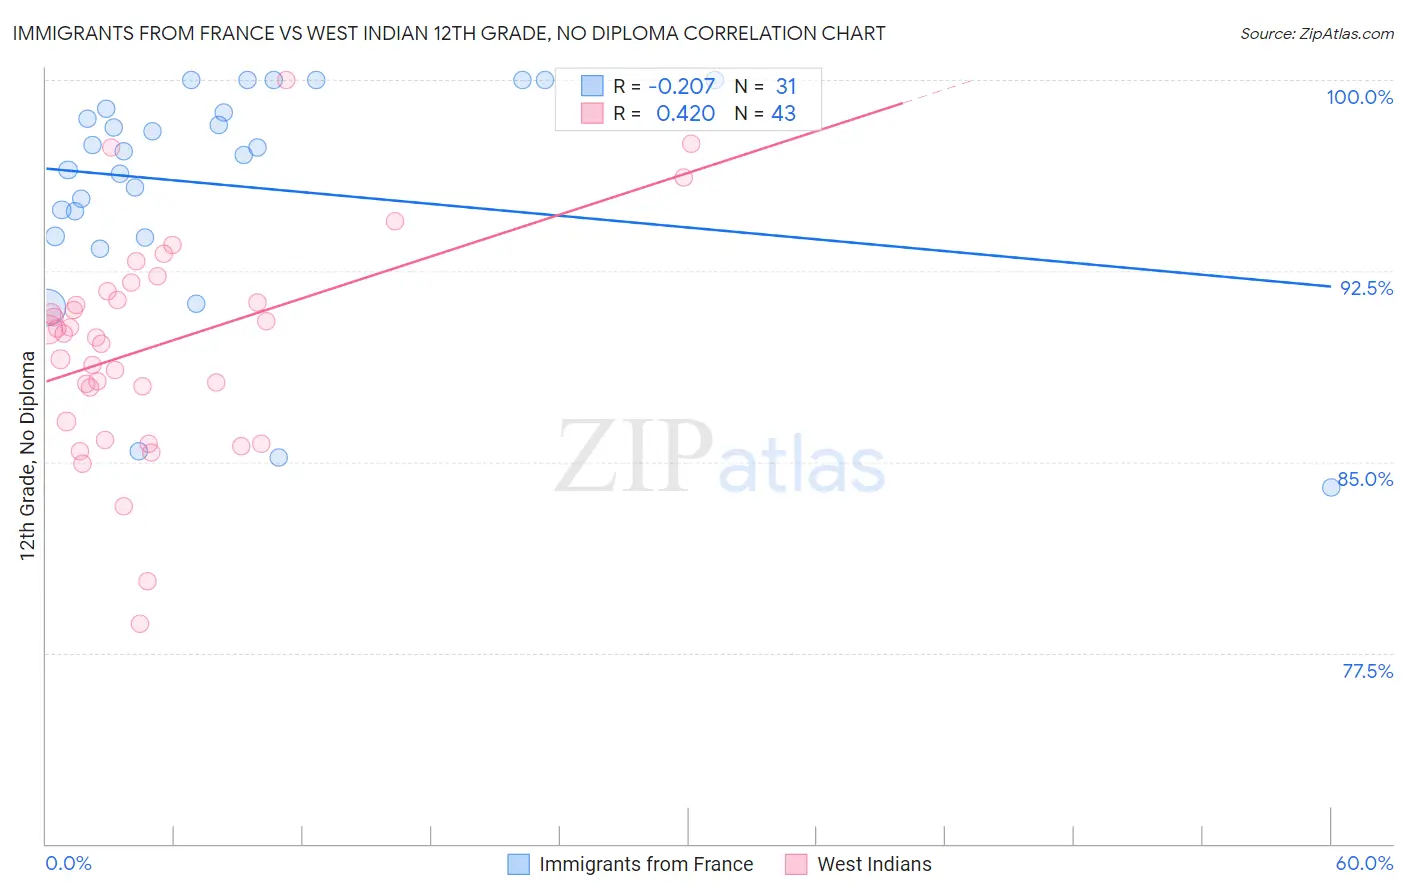
Immigrants from France vs West Indian 12th Grade, No Diploma Correlation Chart
The statistical analysis conducted on geographies consisting of 287,920,906 people shows a weak negative correlation between the proportion of Immigrants from France and percentage of population with at least 12th grade (no diploma) education in the United States with a correlation coefficient (R) of -0.207 and weighted average of 92.4%. Similarly, the statistical analysis conducted on geographies consisting of 254,059,006 people shows a moderate positive correlation between the proportion of West Indians and percentage of population with at least 12th grade (no diploma) education in the United States with a correlation coefficient (R) of 0.420 and weighted average of 89.3%, a difference of 3.4%.
12th Grade, No Diploma Correlation Summary
| Measurement | Immigrants from France | West Indian |
| Minimum | 84.0% | 78.6% |
| Maximum | 100.0% | 100.0% |
| Range | 16.0% | 21.4% |
| Mean | 95.8% | 89.6% |
| Median | 97.2% | 90.0% |
| Interquartile 25% (IQ1) | 93.9% | 86.6% |
| Interquartile 75% (IQ3) | 98.9% | 91.7% |
| Interquartile Range (IQR) | 5.0% | 5.1% |
| Standard Deviation (Sample) | 4.4% | 4.2% |
| Standard Deviation (Population) | 4.4% | 4.2% |
Similar Demographics by 12th Grade, No Diploma
Demographics Similar to Immigrants from France by 12th Grade, No Diploma
In terms of 12th grade, no diploma, the demographic groups most similar to Immigrants from France are Scotch-Irish (92.4%, a difference of 0.010%), Immigrants from Turkey (92.4%, a difference of 0.020%), Canadian (92.4%, a difference of 0.030%), Immigrants from Serbia (92.4%, a difference of 0.040%), and South African (92.4%, a difference of 0.050%).
| Demographics | Rating | Rank | 12th Grade, No Diploma |
| French Canadians | 99.3 /100 | #80 | Exceptional 92.6% |
| Immigrants | Denmark | 99.2 /100 | #81 | Exceptional 92.5% |
| Immigrants | Switzerland | 99.2 /100 | #82 | Exceptional 92.5% |
| Immigrants | Israel | 99.2 /100 | #83 | Exceptional 92.5% |
| Immigrants | Bulgaria | 99.1 /100 | #84 | Exceptional 92.5% |
| Immigrants | Saudi Arabia | 99.0 /100 | #85 | Exceptional 92.5% |
| Immigrants | Turkey | 98.9 /100 | #86 | Exceptional 92.4% |
| Immigrants | France | 98.8 /100 | #87 | Exceptional 92.4% |
| Scotch-Irish | 98.8 /100 | #88 | Exceptional 92.4% |
| Canadians | 98.7 /100 | #89 | Exceptional 92.4% |
| Immigrants | Serbia | 98.6 /100 | #90 | Exceptional 92.4% |
| South Africans | 98.6 /100 | #91 | Exceptional 92.4% |
| Immigrants | Romania | 98.5 /100 | #92 | Exceptional 92.3% |
| Immigrants | Western Europe | 98.5 /100 | #93 | Exceptional 92.3% |
| Immigrants | Europe | 98.5 /100 | #94 | Exceptional 92.3% |
Demographics Similar to West Indians by 12th Grade, No Diploma
In terms of 12th grade, no diploma, the demographic groups most similar to West Indians are Seminole (89.4%, a difference of 0.010%), Immigrants from Trinidad and Tobago (89.3%, a difference of 0.020%), U.S. Virgin Islander (89.3%, a difference of 0.060%), Trinidadian and Tobagonian (89.4%, a difference of 0.080%), and Sri Lankan (89.4%, a difference of 0.090%).
| Demographics | Rating | Rank | 12th Grade, No Diploma |
| Immigrants | South Eastern Asia | 0.4 /100 | #260 | Tragic 89.6% |
| Cheyenne | 0.4 /100 | #261 | Tragic 89.6% |
| Sioux | 0.4 /100 | #262 | Tragic 89.6% |
| Immigrants | Jamaica | 0.2 /100 | #263 | Tragic 89.5% |
| Sri Lankans | 0.2 /100 | #264 | Tragic 89.4% |
| Trinidadians and Tobagonians | 0.2 /100 | #265 | Tragic 89.4% |
| Seminole | 0.2 /100 | #266 | Tragic 89.4% |
| West Indians | 0.2 /100 | #267 | Tragic 89.3% |
| Immigrants | Trinidad and Tobago | 0.1 /100 | #268 | Tragic 89.3% |
| U.S. Virgin Islanders | 0.1 /100 | #269 | Tragic 89.3% |
| Bangladeshis | 0.1 /100 | #270 | Tragic 89.3% |
| Blacks/African Americans | 0.1 /100 | #271 | Tragic 89.3% |
| Malaysians | 0.1 /100 | #272 | Tragic 89.2% |
| Barbadians | 0.1 /100 | #273 | Tragic 89.1% |
| Cajuns | 0.1 /100 | #274 | Tragic 89.1% |