Mongolian vs Potawatomi Professional Degree
COMPARE
Mongolian
Potawatomi
Professional Degree
Professional Degree Comparison
Mongolians
Potawatomi
6.1%
PROFESSIONAL DEGREE
100.0/ 100
METRIC RATING
34th/ 347
METRIC RANK
3.6%
PROFESSIONAL DEGREE
0.5/ 100
METRIC RATING
274th/ 347
METRIC RANK
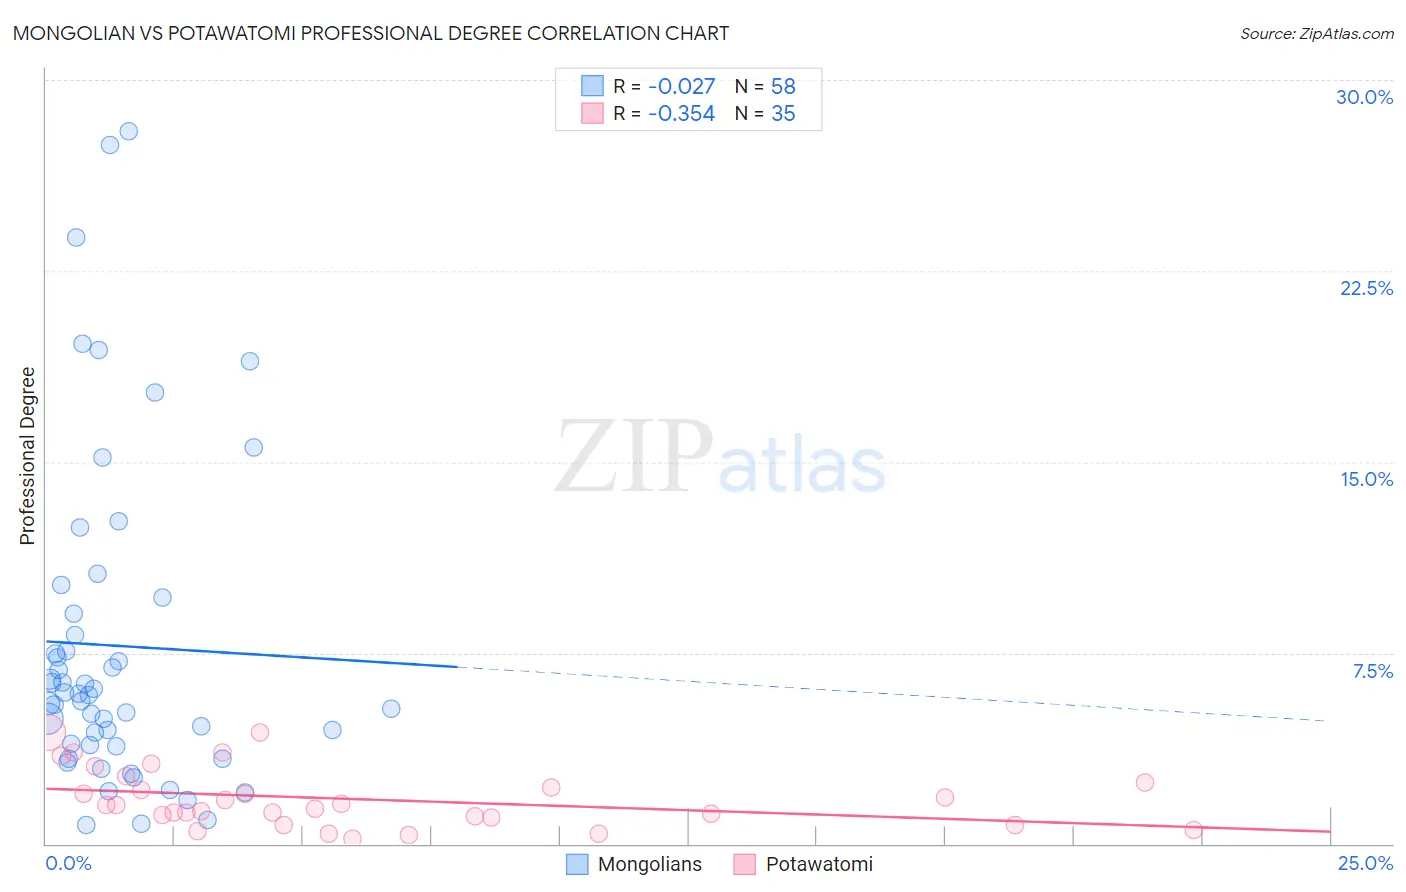
Mongolian vs Potawatomi Professional Degree Correlation Chart
The statistical analysis conducted on geographies consisting of 140,296,057 people shows no correlation between the proportion of Mongolians and percentage of population with at least professional degree education in the United States with a correlation coefficient (R) of -0.027 and weighted average of 6.1%. Similarly, the statistical analysis conducted on geographies consisting of 117,535,348 people shows a mild negative correlation between the proportion of Potawatomi and percentage of population with at least professional degree education in the United States with a correlation coefficient (R) of -0.354 and weighted average of 3.6%, a difference of 72.3%.
Professional Degree Correlation Summary
| Measurement | Mongolian | Potawatomi |
| Minimum | 0.72% | 0.21% |
| Maximum | 28.0% | 4.4% |
| Range | 27.3% | 4.2% |
| Mean | 7.8% | 1.8% |
| Median | 5.9% | 1.5% |
| Interquartile 25% (IQ1) | 3.9% | 1.0% |
| Interquartile 75% (IQ3) | 9.0% | 2.4% |
| Interquartile Range (IQR) | 5.1% | 1.4% |
| Standard Deviation (Sample) | 6.4% | 1.1% |
| Standard Deviation (Population) | 6.3% | 1.1% |
Similar Demographics by Professional Degree
Demographics Similar to Mongolians by Professional Degree
In terms of professional degree, the demographic groups most similar to Mongolians are Burmese (6.1%, a difference of 0.13%), Thai (6.1%, a difference of 0.17%), Immigrants from India (6.2%, a difference of 0.40%), Immigrants from Sri Lanka (6.2%, a difference of 0.52%), and Immigrants from Turkey (6.2%, a difference of 0.52%).
| Demographics | Rating | Rank | Professional Degree |
| Immigrants | Northern Europe | 100.0 /100 | #27 | Exceptional 6.2% |
| Turks | 100.0 /100 | #28 | Exceptional 6.2% |
| Immigrants | Sri Lanka | 100.0 /100 | #29 | Exceptional 6.2% |
| Immigrants | Turkey | 100.0 /100 | #30 | Exceptional 6.2% |
| Immigrants | India | 100.0 /100 | #31 | Exceptional 6.2% |
| Thais | 100.0 /100 | #32 | Exceptional 6.1% |
| Burmese | 100.0 /100 | #33 | Exceptional 6.1% |
| Mongolians | 100.0 /100 | #34 | Exceptional 6.1% |
| Immigrants | Korea | 100.0 /100 | #35 | Exceptional 6.1% |
| Immigrants | Russia | 100.0 /100 | #36 | Exceptional 6.0% |
| Immigrants | Austria | 100.0 /100 | #37 | Exceptional 6.0% |
| Immigrants | Norway | 100.0 /100 | #38 | Exceptional 6.0% |
| Immigrants | South Africa | 100.0 /100 | #39 | Exceptional 6.0% |
| Cambodians | 100.0 /100 | #40 | Exceptional 6.0% |
| New Zealanders | 100.0 /100 | #41 | Exceptional 6.0% |
Demographics Similar to Potawatomi by Professional Degree
In terms of professional degree, the demographic groups most similar to Potawatomi are American (3.6%, a difference of 0.13%), Immigrants from Jamaica (3.6%, a difference of 0.19%), Belizean (3.6%, a difference of 0.22%), Immigrants from Dominica (3.6%, a difference of 0.23%), and Liberian (3.6%, a difference of 0.27%).
| Demographics | Rating | Rank | Professional Degree |
| Delaware | 0.7 /100 | #267 | Tragic 3.6% |
| Aleuts | 0.7 /100 | #268 | Tragic 3.6% |
| Immigrants | Cuba | 0.6 /100 | #269 | Tragic 3.6% |
| Central Americans | 0.6 /100 | #270 | Tragic 3.6% |
| Belizeans | 0.5 /100 | #271 | Tragic 3.6% |
| Immigrants | Jamaica | 0.5 /100 | #272 | Tragic 3.6% |
| Americans | 0.5 /100 | #273 | Tragic 3.6% |
| Potawatomi | 0.5 /100 | #274 | Tragic 3.6% |
| Immigrants | Dominica | 0.5 /100 | #275 | Tragic 3.6% |
| Liberians | 0.5 /100 | #276 | Tragic 3.6% |
| Cheyenne | 0.5 /100 | #277 | Tragic 3.6% |
| Japanese | 0.5 /100 | #278 | Tragic 3.5% |
| Immigrants | Portugal | 0.5 /100 | #279 | Tragic 3.5% |
| Dominicans | 0.5 /100 | #280 | Tragic 3.5% |
| Apache | 0.5 /100 | #281 | Tragic 3.5% |