Dutch West Indian vs Immigrants from Ecuador 6th Grade
COMPARE
Dutch West Indian
Immigrants from Ecuador
6th Grade
6th Grade Comparison
Dutch West Indians
Immigrants from Ecuador
96.9%
6TH GRADE
28.3/ 100
METRIC RATING
190th/ 347
METRIC RANK
95.3%
6TH GRADE
0.0/ 100
METRIC RATING
320th/ 347
METRIC RANK
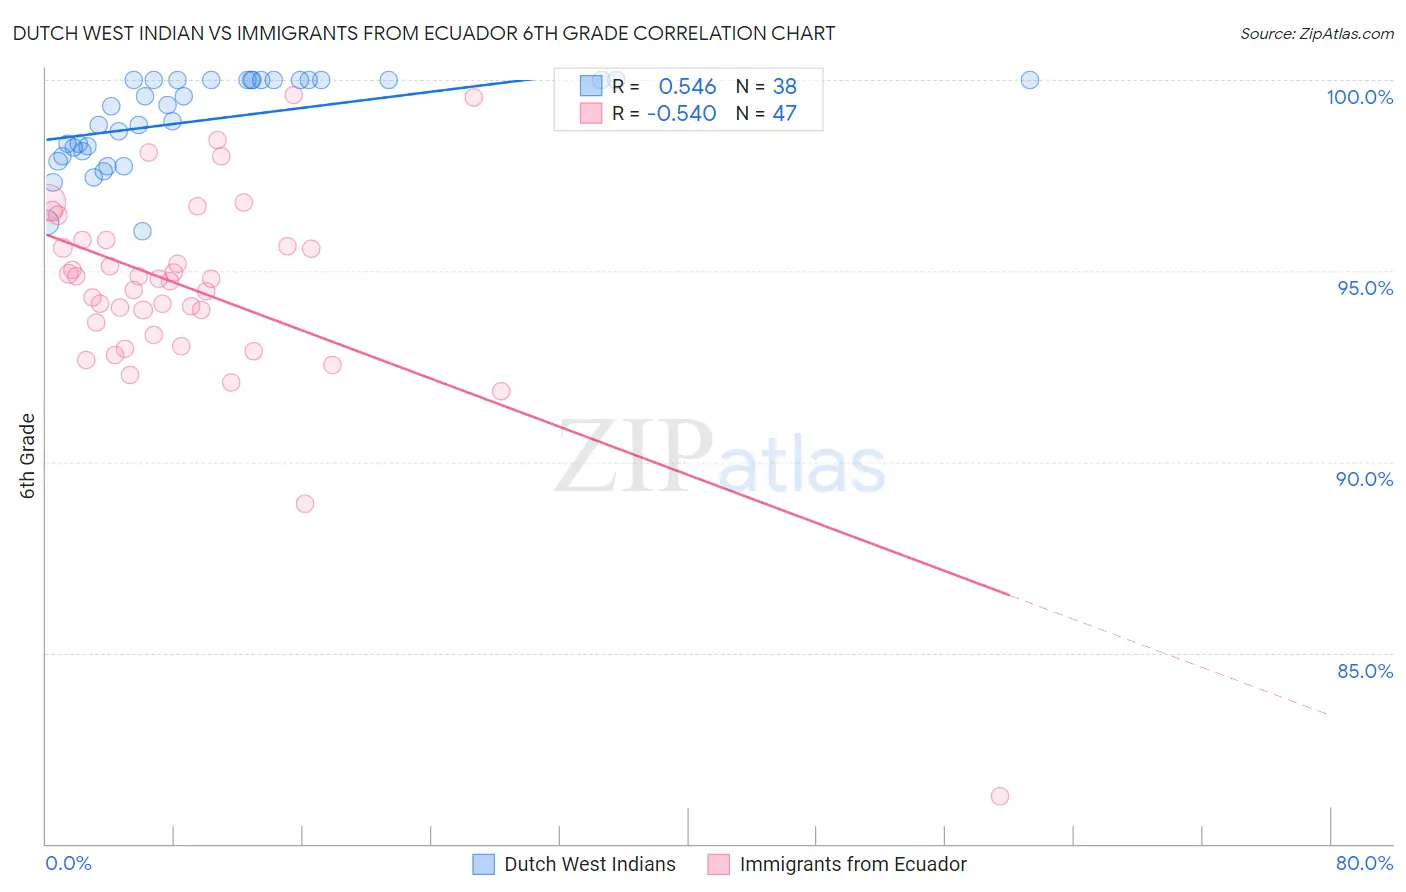
Dutch West Indian vs Immigrants from Ecuador 6th Grade Correlation Chart
The statistical analysis conducted on geographies consisting of 85,776,075 people shows a substantial positive correlation between the proportion of Dutch West Indians and percentage of population with at least 6th grade education in the United States with a correlation coefficient (R) of 0.546 and weighted average of 96.9%. Similarly, the statistical analysis conducted on geographies consisting of 271,020,679 people shows a substantial negative correlation between the proportion of Immigrants from Ecuador and percentage of population with at least 6th grade education in the United States with a correlation coefficient (R) of -0.540 and weighted average of 95.3%, a difference of 1.8%.
6th Grade Correlation Summary
| Measurement | Dutch West Indian | Immigrants from Ecuador |
| Minimum | 96.0% | 81.2% |
| Maximum | 100.0% | 99.6% |
| Range | 4.0% | 18.3% |
| Mean | 99.0% | 94.5% |
| Median | 99.3% | 94.8% |
| Interquartile 25% (IQ1) | 98.1% | 93.3% |
| Interquartile 75% (IQ3) | 100.0% | 95.8% |
| Interquartile Range (IQR) | 1.9% | 2.5% |
| Standard Deviation (Sample) | 1.1% | 2.8% |
| Standard Deviation (Population) | 1.1% | 2.8% |
Similar Demographics by 6th Grade
Demographics Similar to Dutch West Indians by 6th Grade
In terms of 6th grade, the demographic groups most similar to Dutch West Indians are Guamanian/Chamorro (97.0%, a difference of 0.010%), Immigrants from Argentina (97.0%, a difference of 0.010%), Black/African American (97.0%, a difference of 0.010%), Panamanian (96.9%, a difference of 0.010%), and Hawaiian (96.9%, a difference of 0.010%).
| Demographics | Rating | Rank | 6th Grade |
| Immigrants | Venezuela | 34.5 /100 | #183 | Fair 97.0% |
| Spanish Americans | 33.5 /100 | #184 | Fair 97.0% |
| Argentineans | 33.0 /100 | #185 | Fair 97.0% |
| Immigrants | Egypt | 31.4 /100 | #186 | Fair 97.0% |
| Guamanians/Chamorros | 30.6 /100 | #187 | Fair 97.0% |
| Immigrants | Argentina | 30.4 /100 | #188 | Fair 97.0% |
| Blacks/African Americans | 30.2 /100 | #189 | Fair 97.0% |
| Dutch West Indians | 28.3 /100 | #190 | Fair 96.9% |
| Panamanians | 27.3 /100 | #191 | Fair 96.9% |
| Hawaiians | 27.0 /100 | #192 | Fair 96.9% |
| Paraguayans | 26.6 /100 | #193 | Fair 96.9% |
| Immigrants | Lebanon | 25.6 /100 | #194 | Fair 96.9% |
| Immigrants | Brazil | 25.5 /100 | #195 | Fair 96.9% |
| Immigrants | Uganda | 21.2 /100 | #196 | Fair 96.9% |
| Brazilians | 20.1 /100 | #197 | Fair 96.9% |
Demographics Similar to Immigrants from Ecuador by 6th Grade
In terms of 6th grade, the demographic groups most similar to Immigrants from Ecuador are Immigrants from Belize (95.3%, a difference of 0.030%), Belizean (95.3%, a difference of 0.040%), Vietnamese (95.3%, a difference of 0.060%), Immigrants from Fiji (95.2%, a difference of 0.060%), and Japanese (95.4%, a difference of 0.10%).
| Demographics | Rating | Rank | 6th Grade |
| Nicaraguans | 0.0 /100 | #313 | Tragic 95.4% |
| Immigrants | Vietnam | 0.0 /100 | #314 | Tragic 95.4% |
| Immigrants | Bangladesh | 0.0 /100 | #315 | Tragic 95.4% |
| Japanese | 0.0 /100 | #316 | Tragic 95.4% |
| Vietnamese | 0.0 /100 | #317 | Tragic 95.3% |
| Belizeans | 0.0 /100 | #318 | Tragic 95.3% |
| Immigrants | Belize | 0.0 /100 | #319 | Tragic 95.3% |
| Immigrants | Ecuador | 0.0 /100 | #320 | Tragic 95.3% |
| Immigrants | Fiji | 0.0 /100 | #321 | Tragic 95.2% |
| Immigrants | Cambodia | 0.0 /100 | #322 | Tragic 95.2% |
| Central American Indians | 0.0 /100 | #323 | Tragic 95.1% |
| Cape Verdeans | 0.0 /100 | #324 | Tragic 95.1% |
| Immigrants | Nicaragua | 0.0 /100 | #325 | Tragic 95.1% |
| Hispanics or Latinos | 0.0 /100 | #326 | Tragic 95.0% |
| Mexican American Indians | 0.0 /100 | #327 | Tragic 95.0% |