Finnish vs Immigrants from Australia 12th Grade, No Diploma
COMPARE
Finnish
Immigrants from Australia
12th Grade, No Diploma
12th Grade, No Diploma Comparison
Finns
Immigrants from Australia
93.4%
12TH GRADE, NO DIPLOMA
100.0/ 100
METRIC RATING
15th/ 347
METRIC RANK
92.9%
12TH GRADE, NO DIPLOMA
99.8/ 100
METRIC RATING
42nd/ 347
METRIC RANK
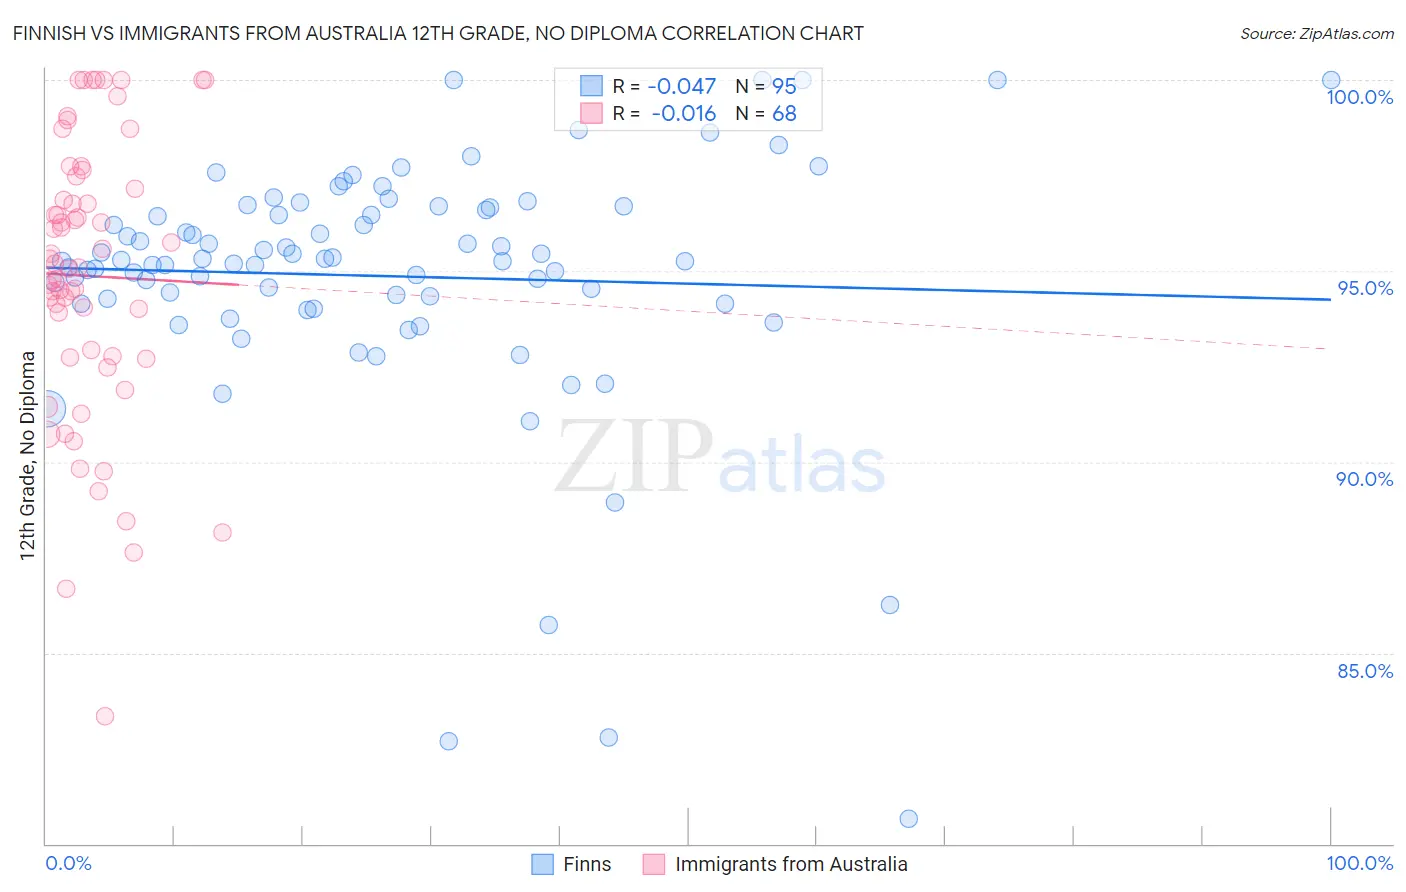
Finnish vs Immigrants from Australia 12th Grade, No Diploma Correlation Chart
The statistical analysis conducted on geographies consisting of 404,676,167 people shows no correlation between the proportion of Finns and percentage of population with at least 12th grade (no diploma) education in the United States with a correlation coefficient (R) of -0.047 and weighted average of 93.4%. Similarly, the statistical analysis conducted on geographies consisting of 227,202,828 people shows no correlation between the proportion of Immigrants from Australia and percentage of population with at least 12th grade (no diploma) education in the United States with a correlation coefficient (R) of -0.016 and weighted average of 92.9%, a difference of 0.45%.
12th Grade, No Diploma Correlation Summary
| Measurement | Finnish | Immigrants from Australia |
| Minimum | 80.6% | 83.3% |
| Maximum | 100.0% | 100.0% |
| Range | 19.4% | 16.7% |
| Mean | 94.9% | 94.9% |
| Median | 95.3% | 95.1% |
| Interquartile 25% (IQ1) | 94.1% | 92.7% |
| Interquartile 75% (IQ3) | 96.7% | 97.3% |
| Interquartile Range (IQR) | 2.5% | 4.6% |
| Standard Deviation (Sample) | 3.3% | 3.7% |
| Standard Deviation (Population) | 3.3% | 3.6% |
Similar Demographics by 12th Grade, No Diploma
Demographics Similar to Finns by 12th Grade, No Diploma
In terms of 12th grade, no diploma, the demographic groups most similar to Finns are Maltese (93.3%, a difference of 0.040%), Luxembourger (93.3%, a difference of 0.060%), Bulgarian (93.5%, a difference of 0.090%), Immigrants from Singapore (93.3%, a difference of 0.090%), and Danish (93.5%, a difference of 0.11%).
| Demographics | Rating | Rank | 12th Grade, No Diploma |
| Chinese | 100.0 /100 | #8 | Exceptional 93.6% |
| Latvians | 100.0 /100 | #9 | Exceptional 93.6% |
| Croatians | 100.0 /100 | #10 | Exceptional 93.5% |
| Poles | 100.0 /100 | #11 | Exceptional 93.5% |
| Eastern Europeans | 100.0 /100 | #12 | Exceptional 93.5% |
| Danes | 100.0 /100 | #13 | Exceptional 93.5% |
| Bulgarians | 100.0 /100 | #14 | Exceptional 93.5% |
| Finns | 100.0 /100 | #15 | Exceptional 93.4% |
| Maltese | 100.0 /100 | #16 | Exceptional 93.3% |
| Luxembourgers | 100.0 /100 | #17 | Exceptional 93.3% |
| Immigrants | Singapore | 99.9 /100 | #18 | Exceptional 93.3% |
| Germans | 99.9 /100 | #19 | Exceptional 93.3% |
| Filipinos | 99.9 /100 | #20 | Exceptional 93.2% |
| Italians | 99.9 /100 | #21 | Exceptional 93.2% |
| Estonians | 99.9 /100 | #22 | Exceptional 93.2% |
Demographics Similar to Immigrants from Australia by 12th Grade, No Diploma
In terms of 12th grade, no diploma, the demographic groups most similar to Immigrants from Australia are Turkish (93.0%, a difference of 0.020%), Bhutanese (93.0%, a difference of 0.020%), Northern European (92.9%, a difference of 0.020%), Dutch (92.9%, a difference of 0.020%), and Tlingit-Haida (93.0%, a difference of 0.030%).
| Demographics | Rating | Rank | 12th Grade, No Diploma |
| English | 99.9 /100 | #35 | Exceptional 93.0% |
| Scottish | 99.9 /100 | #36 | Exceptional 93.0% |
| Irish | 99.9 /100 | #37 | Exceptional 93.0% |
| Tlingit-Haida | 99.8 /100 | #38 | Exceptional 93.0% |
| Immigrants | Austria | 99.8 /100 | #39 | Exceptional 93.0% |
| Turks | 99.8 /100 | #40 | Exceptional 93.0% |
| Bhutanese | 99.8 /100 | #41 | Exceptional 93.0% |
| Immigrants | Australia | 99.8 /100 | #42 | Exceptional 92.9% |
| Northern Europeans | 99.8 /100 | #43 | Exceptional 92.9% |
| Dutch | 99.8 /100 | #44 | Exceptional 92.9% |
| Greeks | 99.8 /100 | #45 | Exceptional 92.9% |
| British | 99.8 /100 | #46 | Exceptional 92.9% |
| Belgians | 99.8 /100 | #47 | Exceptional 92.9% |
| Australians | 99.8 /100 | #48 | Exceptional 92.9% |
| Macedonians | 99.8 /100 | #49 | Exceptional 92.9% |