Immigrants from Canada vs Immigrants from Australia 12th Grade, No Diploma
COMPARE
Immigrants from Canada
Immigrants from Australia
12th Grade, No Diploma
12th Grade, No Diploma Comparison
Immigrants from Canada
Immigrants from Australia
92.8%
12TH GRADE, NO DIPLOMA
99.7/ 100
METRIC RATING
57th/ 347
METRIC RANK
92.9%
12TH GRADE, NO DIPLOMA
99.8/ 100
METRIC RATING
42nd/ 347
METRIC RANK
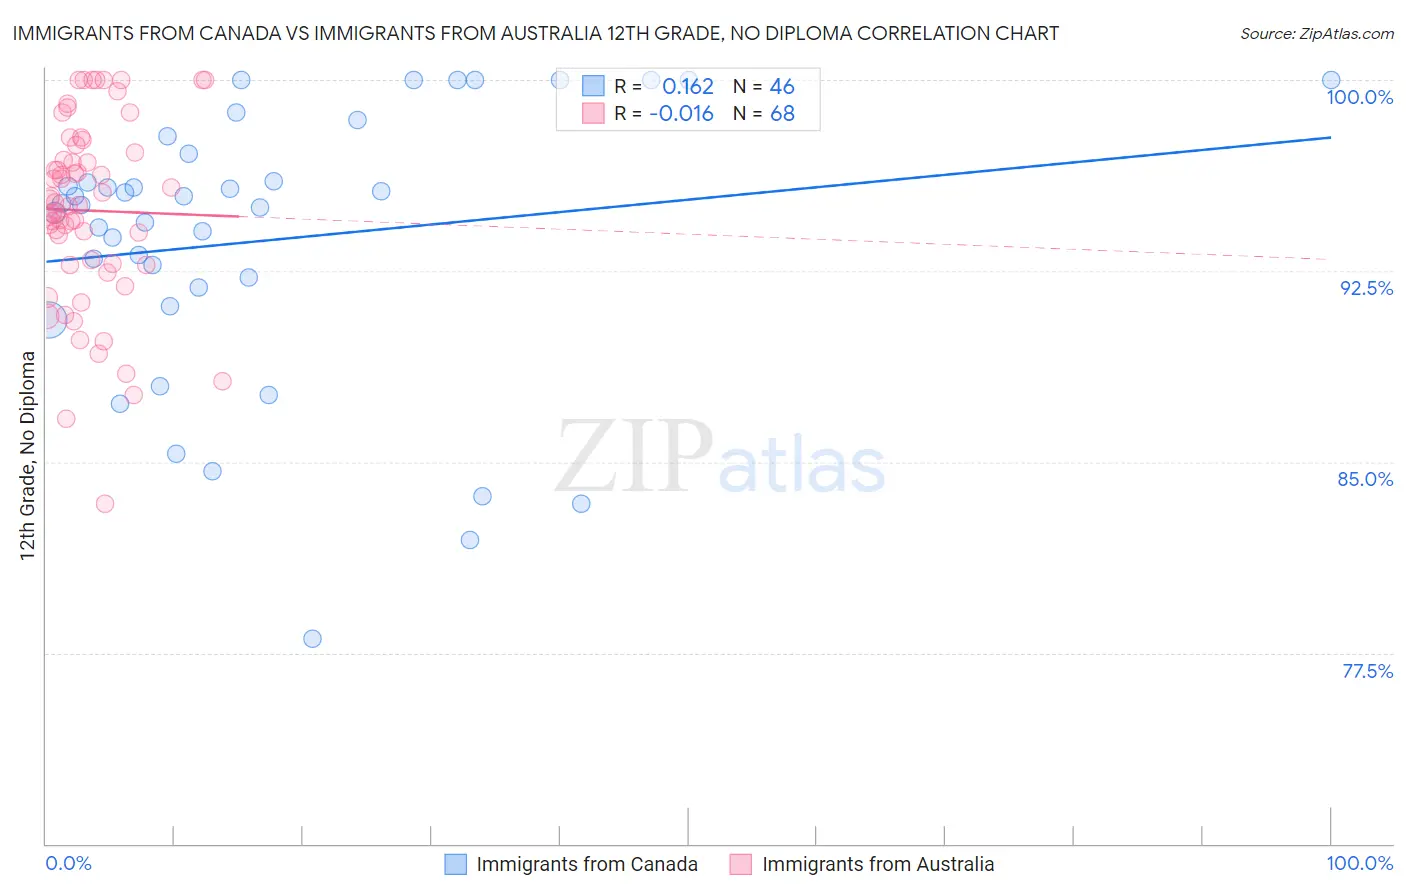
Immigrants from Canada vs Immigrants from Australia 12th Grade, No Diploma Correlation Chart
The statistical analysis conducted on geographies consisting of 459,397,067 people shows a poor positive correlation between the proportion of Immigrants from Canada and percentage of population with at least 12th grade (no diploma) education in the United States with a correlation coefficient (R) of 0.162 and weighted average of 92.8%. Similarly, the statistical analysis conducted on geographies consisting of 227,202,828 people shows no correlation between the proportion of Immigrants from Australia and percentage of population with at least 12th grade (no diploma) education in the United States with a correlation coefficient (R) of -0.016 and weighted average of 92.9%, a difference of 0.15%.
12th Grade, No Diploma Correlation Summary
| Measurement | Immigrants from Canada | Immigrants from Australia |
| Minimum | 78.1% | 83.3% |
| Maximum | 100.0% | 100.0% |
| Range | 21.9% | 16.7% |
| Mean | 93.7% | 94.9% |
| Median | 95.1% | 95.1% |
| Interquartile 25% (IQ1) | 91.9% | 92.7% |
| Interquartile 75% (IQ3) | 97.1% | 97.3% |
| Interquartile Range (IQR) | 5.2% | 4.6% |
| Standard Deviation (Sample) | 5.4% | 3.7% |
| Standard Deviation (Population) | 5.4% | 3.6% |
Demographics Similar to Immigrants from Canada and Immigrants from Australia by 12th Grade, No Diploma
In terms of 12th grade, no diploma, the demographic groups most similar to Immigrants from Canada are Immigrants from Taiwan (92.8%, a difference of 0.020%), Welsh (92.8%, a difference of 0.030%), New Zealander (92.8%, a difference of 0.030%), Immigrants from North America (92.8%, a difference of 0.030%), and Serbian (92.8%, a difference of 0.040%). Similarly, the demographic groups most similar to Immigrants from Australia are Turkish (93.0%, a difference of 0.020%), Bhutanese (93.0%, a difference of 0.020%), Northern European (92.9%, a difference of 0.020%), Dutch (92.9%, a difference of 0.020%), and Immigrants from Austria (93.0%, a difference of 0.030%).
| Demographics | Rating | Rank | 12th Grade, No Diploma |
| Immigrants | Austria | 99.8 /100 | #39 | Exceptional 93.0% |
| Turks | 99.8 /100 | #40 | Exceptional 93.0% |
| Bhutanese | 99.8 /100 | #41 | Exceptional 93.0% |
| Immigrants | Australia | 99.8 /100 | #42 | Exceptional 92.9% |
| Northern Europeans | 99.8 /100 | #43 | Exceptional 92.9% |
| Dutch | 99.8 /100 | #44 | Exceptional 92.9% |
| Greeks | 99.8 /100 | #45 | Exceptional 92.9% |
| British | 99.8 /100 | #46 | Exceptional 92.9% |
| Belgians | 99.8 /100 | #47 | Exceptional 92.9% |
| Australians | 99.8 /100 | #48 | Exceptional 92.9% |
| Macedonians | 99.8 /100 | #49 | Exceptional 92.9% |
| Tsimshian | 99.8 /100 | #50 | Exceptional 92.9% |
| Immigrants | Belgium | 99.8 /100 | #51 | Exceptional 92.9% |
| Immigrants | Sweden | 99.8 /100 | #52 | Exceptional 92.8% |
| Serbians | 99.7 /100 | #53 | Exceptional 92.8% |
| Hungarians | 99.7 /100 | #54 | Exceptional 92.8% |
| Welsh | 99.7 /100 | #55 | Exceptional 92.8% |
| New Zealanders | 99.7 /100 | #56 | Exceptional 92.8% |
| Immigrants | Canada | 99.7 /100 | #57 | Exceptional 92.8% |
| Immigrants | Taiwan | 99.7 /100 | #58 | Exceptional 92.8% |
| Immigrants | North America | 99.7 /100 | #59 | Exceptional 92.8% |