Ottawa vs Immigrants from China 12th Grade, No Diploma
COMPARE
Ottawa
Immigrants from China
12th Grade, No Diploma
12th Grade, No Diploma Comparison
Ottawa
Immigrants from China
91.9%
12TH GRADE, NO DIPLOMA
93.1/ 100
METRIC RATING
122nd/ 347
METRIC RANK
91.3%
12TH GRADE, NO DIPLOMA
60.9/ 100
METRIC RATING
164th/ 347
METRIC RANK
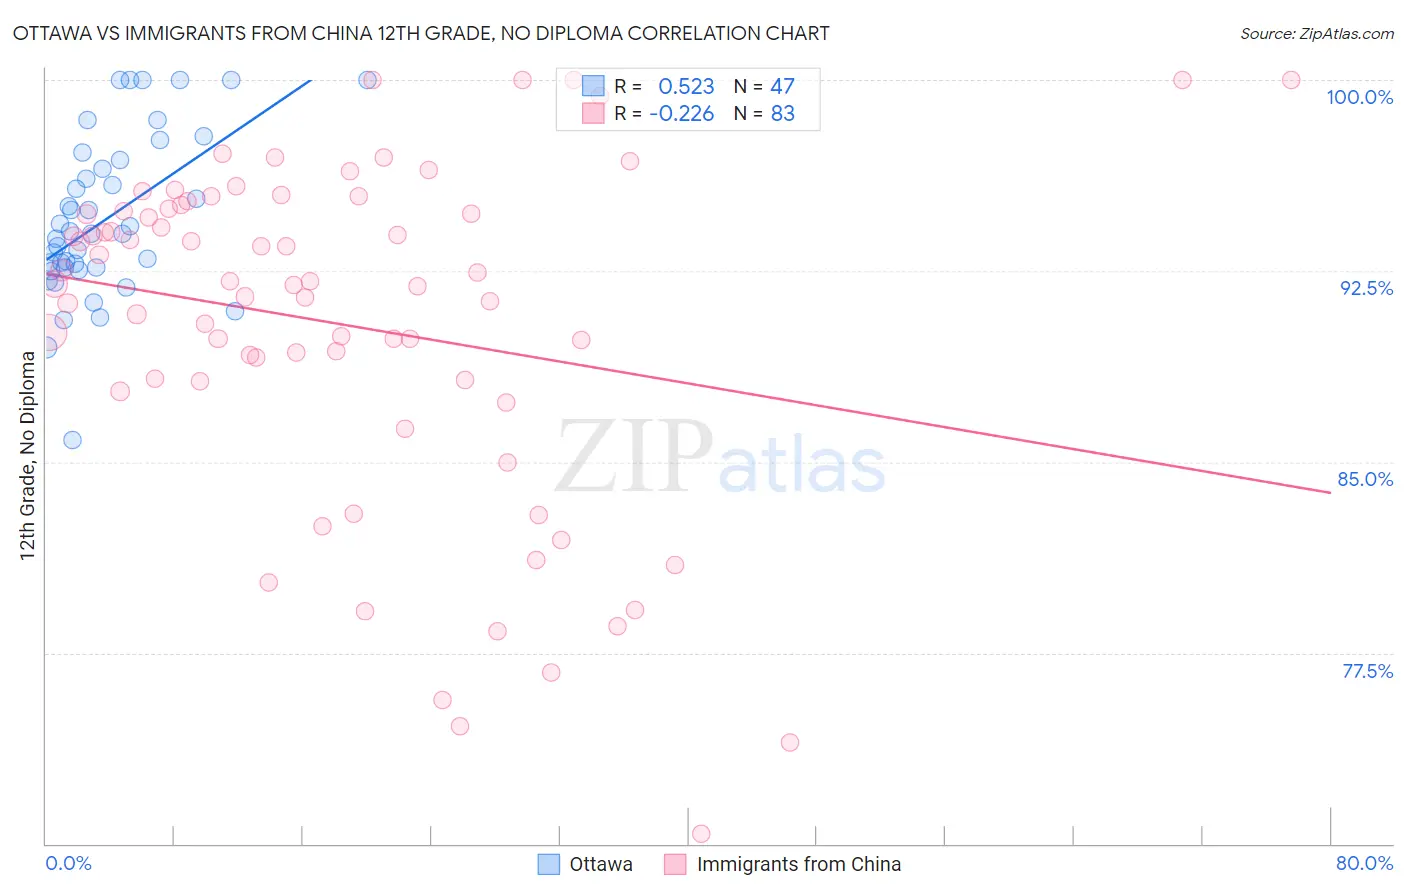
Ottawa vs Immigrants from China 12th Grade, No Diploma Correlation Chart
The statistical analysis conducted on geographies consisting of 49,956,602 people shows a substantial positive correlation between the proportion of Ottawa and percentage of population with at least 12th grade (no diploma) education in the United States with a correlation coefficient (R) of 0.523 and weighted average of 91.9%. Similarly, the statistical analysis conducted on geographies consisting of 457,082,916 people shows a weak negative correlation between the proportion of Immigrants from China and percentage of population with at least 12th grade (no diploma) education in the United States with a correlation coefficient (R) of -0.226 and weighted average of 91.3%, a difference of 0.66%.
12th Grade, No Diploma Correlation Summary
| Measurement | Ottawa | Immigrants from China |
| Minimum | 85.8% | 70.4% |
| Maximum | 100.0% | 100.0% |
| Range | 14.2% | 29.6% |
| Mean | 94.6% | 90.4% |
| Median | 94.0% | 92.0% |
| Interquartile 25% (IQ1) | 92.6% | 88.2% |
| Interquartile 75% (IQ3) | 96.9% | 95.0% |
| Interquartile Range (IQR) | 4.2% | 6.8% |
| Standard Deviation (Sample) | 3.2% | 6.7% |
| Standard Deviation (Population) | 3.1% | 6.7% |
Similar Demographics by 12th Grade, No Diploma
Demographics Similar to Ottawa by 12th Grade, No Diploma
In terms of 12th grade, no diploma, the demographic groups most similar to Ottawa are Menominee (91.9%, a difference of 0.020%), Egyptian (91.9%, a difference of 0.030%), Immigrants from Kazakhstan (91.9%, a difference of 0.050%), Immigrants from Ukraine (91.8%, a difference of 0.070%), and White/Caucasian (91.8%, a difference of 0.070%).
| Demographics | Rating | Rank | 12th Grade, No Diploma |
| Immigrants | Sri Lanka | 96.4 /100 | #115 | Exceptional 92.1% |
| Aleuts | 96.3 /100 | #116 | Exceptional 92.1% |
| Immigrants | Eastern Europe | 96.3 /100 | #117 | Exceptional 92.1% |
| Puget Sound Salish | 95.8 /100 | #118 | Exceptional 92.0% |
| Immigrants | Germany | 95.5 /100 | #119 | Exceptional 92.0% |
| Immigrants | Kazakhstan | 94.2 /100 | #120 | Exceptional 91.9% |
| Menominee | 93.5 /100 | #121 | Exceptional 91.9% |
| Ottawa | 93.1 /100 | #122 | Exceptional 91.9% |
| Egyptians | 92.5 /100 | #123 | Exceptional 91.9% |
| Immigrants | Ukraine | 91.6 /100 | #124 | Exceptional 91.8% |
| Whites/Caucasians | 91.6 /100 | #125 | Exceptional 91.8% |
| Basques | 91.3 /100 | #126 | Exceptional 91.8% |
| Immigrants | Jordan | 91.0 /100 | #127 | Exceptional 91.8% |
| Mongolians | 89.9 /100 | #128 | Excellent 91.8% |
| German Russians | 89.8 /100 | #129 | Excellent 91.8% |
Demographics Similar to Immigrants from China by 12th Grade, No Diploma
In terms of 12th grade, no diploma, the demographic groups most similar to Immigrants from China are Brazilian (91.3%, a difference of 0.010%), Immigrants from Asia (91.3%, a difference of 0.010%), Alsatian (91.3%, a difference of 0.030%), Immigrants from Albania (91.3%, a difference of 0.040%), and Immigrants from Hong Kong (91.3%, a difference of 0.040%).
| Demographics | Rating | Rank | 12th Grade, No Diploma |
| Immigrants | Pakistan | 70.7 /100 | #157 | Good 91.4% |
| Immigrants | Northern Africa | 66.2 /100 | #158 | Good 91.4% |
| Laotians | 64.4 /100 | #159 | Good 91.3% |
| Immigrants | Albania | 64.1 /100 | #160 | Good 91.3% |
| Immigrants | Hong Kong | 63.8 /100 | #161 | Good 91.3% |
| Brazilians | 62.0 /100 | #162 | Good 91.3% |
| Immigrants | Asia | 61.5 /100 | #163 | Good 91.3% |
| Immigrants | China | 60.9 /100 | #164 | Good 91.3% |
| Alsatians | 58.3 /100 | #165 | Average 91.3% |
| Hmong | 58.0 /100 | #166 | Average 91.3% |
| Immigrants | Malaysia | 57.8 /100 | #167 | Average 91.3% |
| Cree | 57.0 /100 | #168 | Average 91.2% |
| Immigrants | Indonesia | 54.9 /100 | #169 | Average 91.2% |
| Delaware | 52.8 /100 | #170 | Average 91.2% |
| Immigrants | Morocco | 51.4 /100 | #171 | Average 91.2% |