Ottawa vs Lithuanian 12th Grade, No Diploma
COMPARE
Ottawa
Lithuanian
12th Grade, No Diploma
12th Grade, No Diploma Comparison
Ottawa
Lithuanians
91.9%
12TH GRADE, NO DIPLOMA
93.1/ 100
METRIC RATING
122nd/ 347
METRIC RANK
93.6%
12TH GRADE, NO DIPLOMA
100.0/ 100
METRIC RATING
3rd/ 347
METRIC RANK
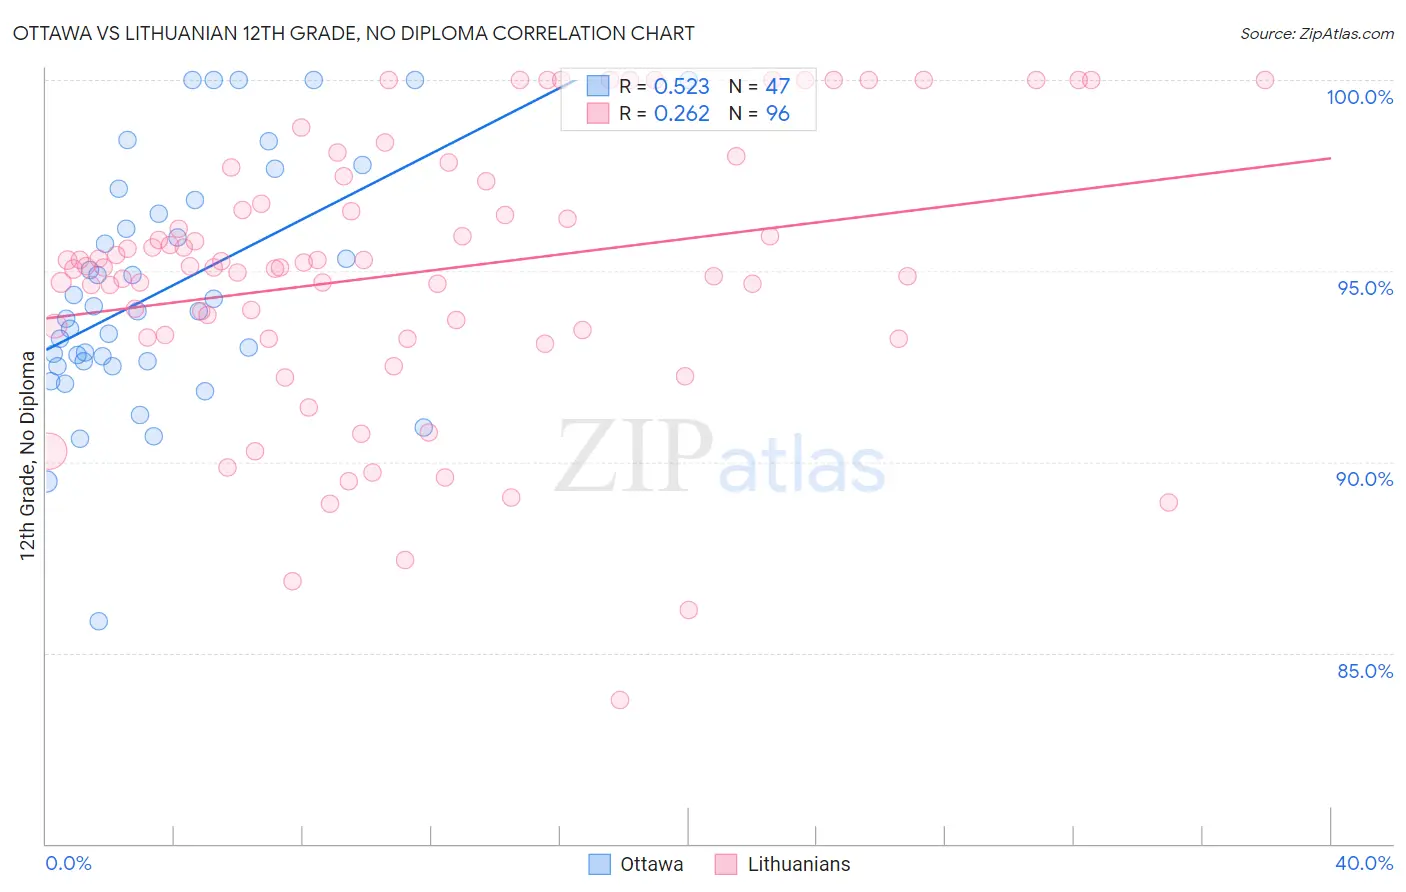
Ottawa vs Lithuanian 12th Grade, No Diploma Correlation Chart
The statistical analysis conducted on geographies consisting of 49,956,602 people shows a substantial positive correlation between the proportion of Ottawa and percentage of population with at least 12th grade (no diploma) education in the United States with a correlation coefficient (R) of 0.523 and weighted average of 91.9%. Similarly, the statistical analysis conducted on geographies consisting of 421,947,832 people shows a weak positive correlation between the proportion of Lithuanians and percentage of population with at least 12th grade (no diploma) education in the United States with a correlation coefficient (R) of 0.262 and weighted average of 93.6%, a difference of 1.9%.
12th Grade, No Diploma Correlation Summary
| Measurement | Ottawa | Lithuanian |
| Minimum | 85.8% | 83.8% |
| Maximum | 100.0% | 100.0% |
| Range | 14.2% | 16.2% |
| Mean | 94.6% | 94.9% |
| Median | 94.0% | 95.1% |
| Interquartile 25% (IQ1) | 92.6% | 93.3% |
| Interquartile 75% (IQ3) | 96.9% | 97.1% |
| Interquartile Range (IQR) | 4.2% | 3.8% |
| Standard Deviation (Sample) | 3.2% | 3.5% |
| Standard Deviation (Population) | 3.1% | 3.5% |
Similar Demographics by 12th Grade, No Diploma
Demographics Similar to Ottawa by 12th Grade, No Diploma
In terms of 12th grade, no diploma, the demographic groups most similar to Ottawa are Menominee (91.9%, a difference of 0.020%), Egyptian (91.9%, a difference of 0.030%), Immigrants from Kazakhstan (91.9%, a difference of 0.050%), Immigrants from Ukraine (91.8%, a difference of 0.070%), and White/Caucasian (91.8%, a difference of 0.070%).
| Demographics | Rating | Rank | 12th Grade, No Diploma |
| Immigrants | Sri Lanka | 96.4 /100 | #115 | Exceptional 92.1% |
| Aleuts | 96.3 /100 | #116 | Exceptional 92.1% |
| Immigrants | Eastern Europe | 96.3 /100 | #117 | Exceptional 92.1% |
| Puget Sound Salish | 95.8 /100 | #118 | Exceptional 92.0% |
| Immigrants | Germany | 95.5 /100 | #119 | Exceptional 92.0% |
| Immigrants | Kazakhstan | 94.2 /100 | #120 | Exceptional 91.9% |
| Menominee | 93.5 /100 | #121 | Exceptional 91.9% |
| Ottawa | 93.1 /100 | #122 | Exceptional 91.9% |
| Egyptians | 92.5 /100 | #123 | Exceptional 91.9% |
| Immigrants | Ukraine | 91.6 /100 | #124 | Exceptional 91.8% |
| Whites/Caucasians | 91.6 /100 | #125 | Exceptional 91.8% |
| Basques | 91.3 /100 | #126 | Exceptional 91.8% |
| Immigrants | Jordan | 91.0 /100 | #127 | Exceptional 91.8% |
| Mongolians | 89.9 /100 | #128 | Excellent 91.8% |
| German Russians | 89.8 /100 | #129 | Excellent 91.8% |
Demographics Similar to Lithuanians by 12th Grade, No Diploma
In terms of 12th grade, no diploma, the demographic groups most similar to Lithuanians are Slovene (93.6%, a difference of 0.010%), Carpatho Rusyn (93.6%, a difference of 0.020%), Immigrants from India (93.6%, a difference of 0.030%), Slovak (93.6%, a difference of 0.070%), and Chinese (93.6%, a difference of 0.070%).
| Demographics | Rating | Rank | 12th Grade, No Diploma |
| Norwegians | 100.0 /100 | #1 | Exceptional 94.0% |
| Swedes | 100.0 /100 | #2 | Exceptional 93.7% |
| Lithuanians | 100.0 /100 | #3 | Exceptional 93.6% |
| Slovenes | 100.0 /100 | #4 | Exceptional 93.6% |
| Carpatho Rusyns | 100.0 /100 | #5 | Exceptional 93.6% |
| Immigrants | India | 100.0 /100 | #6 | Exceptional 93.6% |
| Slovaks | 100.0 /100 | #7 | Exceptional 93.6% |
| Chinese | 100.0 /100 | #8 | Exceptional 93.6% |
| Latvians | 100.0 /100 | #9 | Exceptional 93.6% |
| Croatians | 100.0 /100 | #10 | Exceptional 93.5% |
| Poles | 100.0 /100 | #11 | Exceptional 93.5% |
| Eastern Europeans | 100.0 /100 | #12 | Exceptional 93.5% |
| Danes | 100.0 /100 | #13 | Exceptional 93.5% |
| Bulgarians | 100.0 /100 | #14 | Exceptional 93.5% |
| Finns | 100.0 /100 | #15 | Exceptional 93.4% |