Nonimmigrants vs Immigrants from Philippines 12th Grade, No Diploma
COMPARE
Nonimmigrants
Immigrants from Philippines
12th Grade, No Diploma
12th Grade, No Diploma Comparison
Nonimmigrants
Immigrants from Philippines
91.0%
12TH GRADE, NO DIPLOMA
38.8/ 100
METRIC RATING
182nd/ 347
METRIC RANK
90.2%
12TH GRADE, NO DIPLOMA
2.8/ 100
METRIC RATING
230th/ 347
METRIC RANK
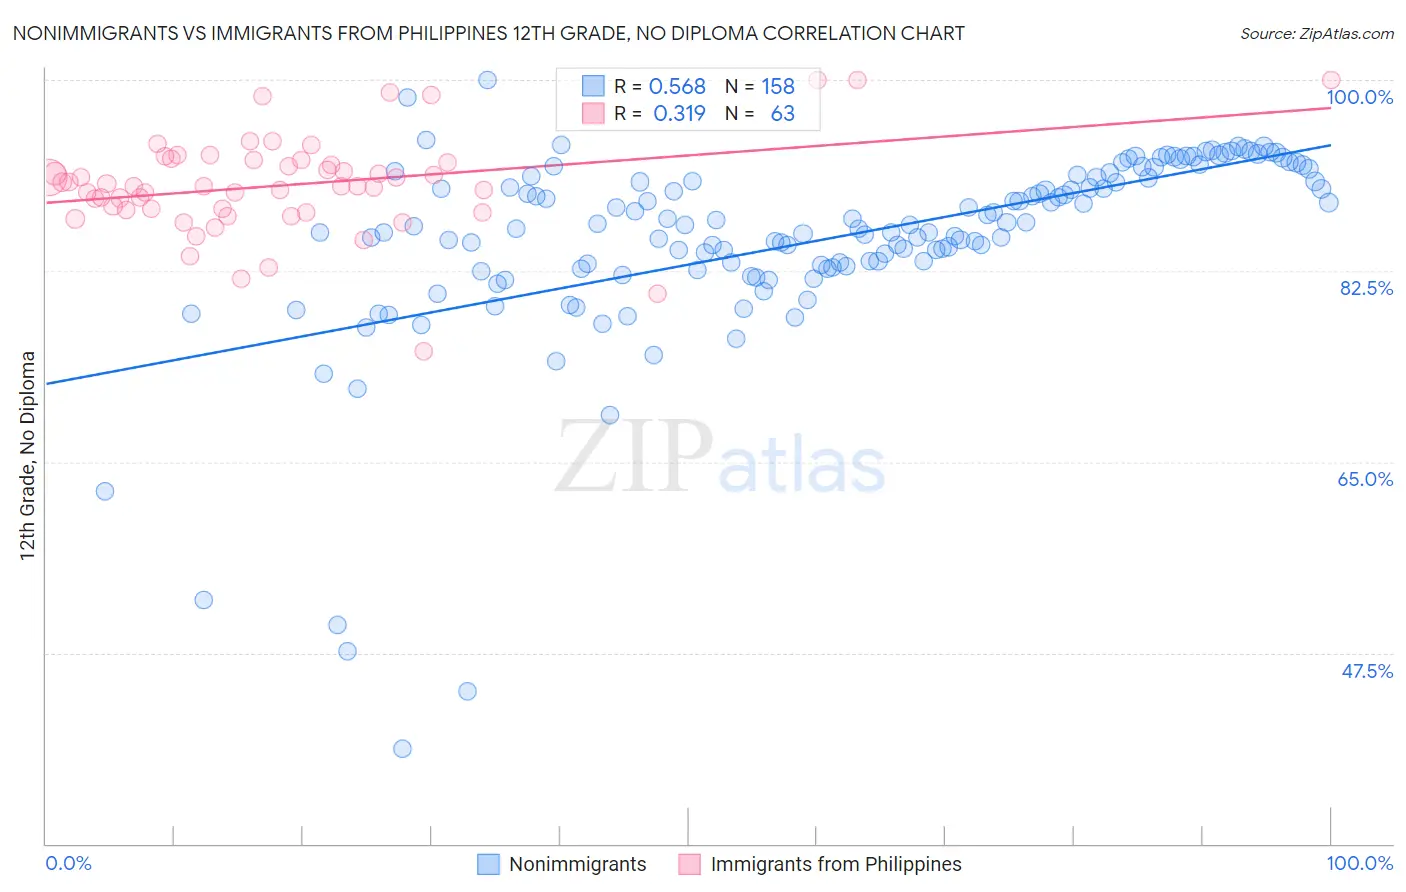
Nonimmigrants vs Immigrants from Philippines 12th Grade, No Diploma Correlation Chart
The statistical analysis conducted on geographies consisting of 585,370,179 people shows a substantial positive correlation between the proportion of Nonimmigrants and percentage of population with at least 12th grade (no diploma) education in the United States with a correlation coefficient (R) of 0.568 and weighted average of 91.0%. Similarly, the statistical analysis conducted on geographies consisting of 471,300,535 people shows a mild positive correlation between the proportion of Immigrants from Philippines and percentage of population with at least 12th grade (no diploma) education in the United States with a correlation coefficient (R) of 0.319 and weighted average of 90.2%, a difference of 0.96%.
12th Grade, No Diploma Correlation Summary
| Measurement | Nonimmigrants | Immigrants from Philippines |
| Minimum | 38.7% | 75.1% |
| Maximum | 100.0% | 100.0% |
| Range | 61.3% | 24.9% |
| Mean | 85.3% | 90.4% |
| Median | 86.5% | 90.3% |
| Interquartile 25% (IQ1) | 82.8% | 88.1% |
| Interquartile 75% (IQ3) | 91.1% | 92.6% |
| Interquartile Range (IQR) | 8.3% | 4.6% |
| Standard Deviation (Sample) | 9.1% | 4.5% |
| Standard Deviation (Population) | 9.1% | 4.5% |
Similar Demographics by 12th Grade, No Diploma
Demographics Similar to Nonimmigrants by 12th Grade, No Diploma
In terms of 12th grade, no diploma, the demographic groups most similar to Nonimmigrants are Guamanian/Chamorro (91.0%, a difference of 0.010%), Osage (91.0%, a difference of 0.010%), Immigrants from Syria (91.1%, a difference of 0.020%), Spaniard (91.0%, a difference of 0.030%), and Spanish (91.1%, a difference of 0.060%).
| Demographics | Rating | Rank | 12th Grade, No Diploma |
| Immigrants | Western Asia | 49.0 /100 | #175 | Average 91.2% |
| Iroquois | 48.5 /100 | #176 | Average 91.1% |
| Sierra Leoneans | 47.7 /100 | #177 | Average 91.1% |
| Spanish | 43.7 /100 | #178 | Average 91.1% |
| Immigrants | Chile | 43.3 /100 | #179 | Average 91.1% |
| Immigrants | Syria | 40.3 /100 | #180 | Average 91.1% |
| Guamanians/Chamorros | 39.5 /100 | #181 | Fair 91.0% |
| Immigrants | Nonimmigrants | 38.8 /100 | #182 | Fair 91.0% |
| Osage | 38.3 /100 | #183 | Fair 91.0% |
| Spaniards | 36.2 /100 | #184 | Fair 91.0% |
| Sudanese | 34.4 /100 | #185 | Fair 91.0% |
| Ethiopians | 33.9 /100 | #186 | Fair 91.0% |
| Potawatomi | 32.9 /100 | #187 | Fair 91.0% |
| Americans | 32.6 /100 | #188 | Fair 91.0% |
| Immigrants | Uganda | 31.6 /100 | #189 | Fair 90.9% |
Demographics Similar to Immigrants from Philippines by 12th Grade, No Diploma
In terms of 12th grade, no diploma, the demographic groups most similar to Immigrants from Philippines are Peruvian (90.2%, a difference of 0.010%), Blackfeet (90.1%, a difference of 0.050%), Immigrants from Thailand (90.1%, a difference of 0.070%), Immigrants from South America (90.1%, a difference of 0.070%), and Colville (90.1%, a difference of 0.070%).
| Demographics | Rating | Rank | 12th Grade, No Diploma |
| South Americans | 5.0 /100 | #223 | Tragic 90.3% |
| Immigrants | Panama | 4.8 /100 | #224 | Tragic 90.3% |
| Chickasaw | 4.8 /100 | #225 | Tragic 90.3% |
| Immigrants | Zaire | 4.6 /100 | #226 | Tragic 90.3% |
| Nigerians | 4.5 /100 | #227 | Tragic 90.3% |
| Creek | 3.9 /100 | #228 | Tragic 90.3% |
| Immigrants | Bahamas | 3.6 /100 | #229 | Tragic 90.2% |
| Immigrants | Philippines | 2.8 /100 | #230 | Tragic 90.2% |
| Peruvians | 2.7 /100 | #231 | Tragic 90.2% |
| Blackfeet | 2.4 /100 | #232 | Tragic 90.1% |
| Immigrants | Thailand | 2.3 /100 | #233 | Tragic 90.1% |
| Immigrants | South America | 2.3 /100 | #234 | Tragic 90.1% |
| Colville | 2.3 /100 | #235 | Tragic 90.1% |
| Immigrants | Uzbekistan | 2.2 /100 | #236 | Tragic 90.1% |
| Immigrants | Colombia | 2.1 /100 | #237 | Tragic 90.1% |