Ottawa vs Immigrants from Belize 10th Grade
COMPARE
Ottawa
Immigrants from Belize
10th Grade
10th Grade Comparison
Ottawa
Immigrants from Belize
95.1%
10TH GRADE
99.8/ 100
METRIC RATING
52nd/ 347
METRIC RANK
90.1%
10TH GRADE
0.0/ 100
METRIC RATING
323rd/ 347
METRIC RANK
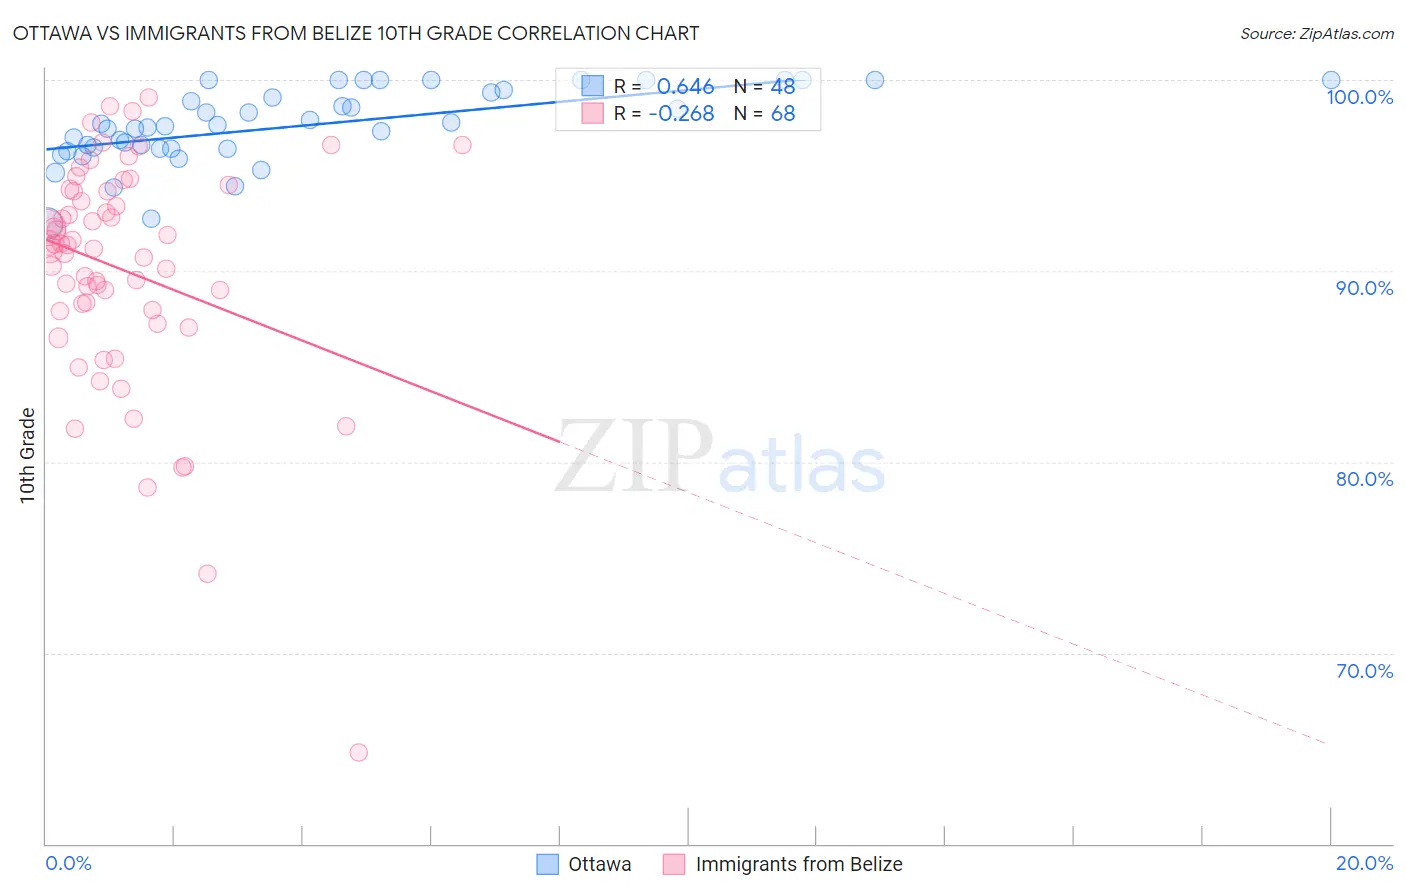
Ottawa vs Immigrants from Belize 10th Grade Correlation Chart
The statistical analysis conducted on geographies consisting of 49,956,726 people shows a significant positive correlation between the proportion of Ottawa and percentage of population with at least 10th grade education in the United States with a correlation coefficient (R) of 0.646 and weighted average of 95.1%. Similarly, the statistical analysis conducted on geographies consisting of 130,181,087 people shows a weak negative correlation between the proportion of Immigrants from Belize and percentage of population with at least 10th grade education in the United States with a correlation coefficient (R) of -0.268 and weighted average of 90.1%, a difference of 5.6%.
10th Grade Correlation Summary
| Measurement | Ottawa | Immigrants from Belize |
| Minimum | 92.5% | 64.8% |
| Maximum | 100.0% | 99.1% |
| Range | 7.5% | 34.4% |
| Mean | 97.6% | 90.1% |
| Median | 97.6% | 91.3% |
| Interquartile 25% (IQ1) | 96.4% | 87.9% |
| Interquartile 75% (IQ3) | 99.4% | 94.2% |
| Interquartile Range (IQR) | 3.0% | 6.2% |
| Standard Deviation (Sample) | 2.0% | 6.0% |
| Standard Deviation (Population) | 1.9% | 6.0% |
Similar Demographics by 10th Grade
Demographics Similar to Ottawa by 10th Grade
In terms of 10th grade, the demographic groups most similar to Ottawa are Austrian (95.1%, a difference of 0.0%), Immigrants from Canada (95.1%, a difference of 0.010%), Immigrants from North America (95.0%, a difference of 0.010%), Immigrants from Lithuania (95.0%, a difference of 0.030%), and Immigrants from Austria (95.1%, a difference of 0.040%).
| Demographics | Rating | Rank | 10th Grade |
| Greeks | 99.9 /100 | #45 | Exceptional 95.2% |
| Czechoslovakians | 99.9 /100 | #46 | Exceptional 95.1% |
| Serbians | 99.9 /100 | #47 | Exceptional 95.1% |
| Australians | 99.9 /100 | #48 | Exceptional 95.1% |
| Immigrants | Austria | 99.9 /100 | #49 | Exceptional 95.1% |
| Immigrants | Canada | 99.8 /100 | #50 | Exceptional 95.1% |
| Austrians | 99.8 /100 | #51 | Exceptional 95.1% |
| Ottawa | 99.8 /100 | #52 | Exceptional 95.1% |
| Immigrants | North America | 99.8 /100 | #53 | Exceptional 95.0% |
| Immigrants | Lithuania | 99.8 /100 | #54 | Exceptional 95.0% |
| Immigrants | Ireland | 99.8 /100 | #55 | Exceptional 95.0% |
| New Zealanders | 99.8 /100 | #56 | Exceptional 95.0% |
| Ukrainians | 99.8 /100 | #57 | Exceptional 95.0% |
| Aleuts | 99.8 /100 | #58 | Exceptional 95.0% |
| Celtics | 99.8 /100 | #59 | Exceptional 95.0% |
Demographics Similar to Immigrants from Belize by 10th Grade
In terms of 10th grade, the demographic groups most similar to Immigrants from Belize are Tohono O'odham (90.1%, a difference of 0.090%), Belizean (90.2%, a difference of 0.10%), Nicaraguan (90.2%, a difference of 0.11%), Houma (90.2%, a difference of 0.11%), and Immigrants from Cuba (90.2%, a difference of 0.19%).
| Demographics | Rating | Rank | 10th Grade |
| Ecuadorians | 0.0 /100 | #316 | Tragic 90.6% |
| Immigrants | Ecuador | 0.0 /100 | #317 | Tragic 90.4% |
| Immigrants | Cuba | 0.0 /100 | #318 | Tragic 90.2% |
| Nicaraguans | 0.0 /100 | #319 | Tragic 90.2% |
| Houma | 0.0 /100 | #320 | Tragic 90.2% |
| Belizeans | 0.0 /100 | #321 | Tragic 90.2% |
| Tohono O'odham | 0.0 /100 | #322 | Tragic 90.1% |
| Immigrants | Belize | 0.0 /100 | #323 | Tragic 90.1% |
| Immigrants | Armenia | 0.0 /100 | #324 | Tragic 89.9% |
| Puerto Ricans | 0.0 /100 | #325 | Tragic 89.8% |
| Central American Indians | 0.0 /100 | #326 | Tragic 89.7% |
| Immigrants | Nicaragua | 0.0 /100 | #327 | Tragic 89.5% |
| Immigrants | Cabo Verde | 0.0 /100 | #328 | Tragic 89.5% |
| Dominicans | 0.0 /100 | #329 | Tragic 89.4% |
| Immigrants | Yemen | 0.0 /100 | #330 | Tragic 89.1% |